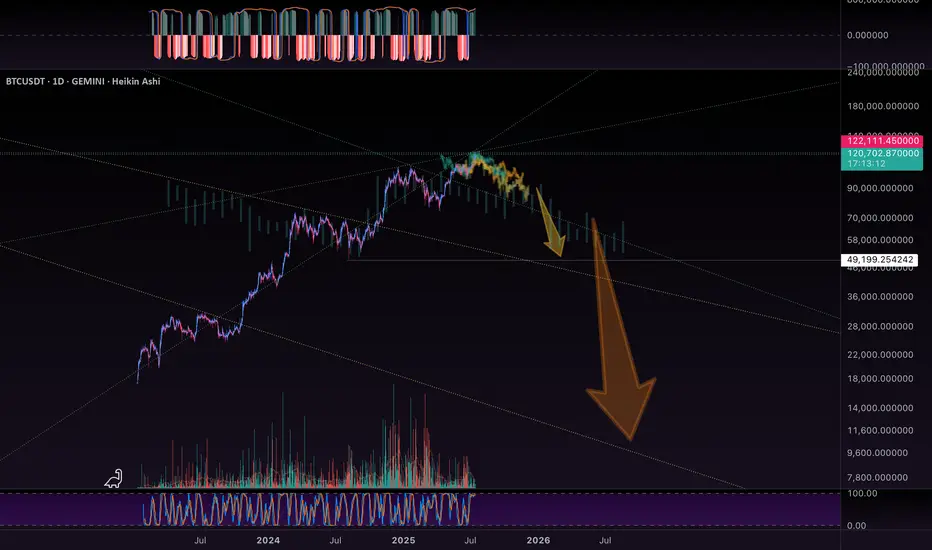
BTC - Historic Levels to CheckBTC has some checking in to do…. On historic resistance levels…
I drew in the major ones visible on this chart… and the initial bearish fractal, which was shown to us previously int he chart.
It will fractal for each arrow.
Pump and Dump!
Im going to run my DOGe.
See my linked post below for a bigger picture view of all this.
Bticoin
Bitcoin will fall to support line of channel and then rebound upHello traders, I want share with you my opinion about Bitcoin. Bitcoin spent a considerable period trading within a horizontal range, bounded by the buyer zone around 92000 - 93000 points and the upper boundary just below 103000 points. Throughout this phase, the price respected both limits, bouncing between support and resistance, forming a stable consolidation base. Eventually, BTC broke out of this range with a strong bullish impulse, entering a clearly defined upward channel. Since then, price action has been guided by the structure of this rising channel, consistently forming higher highs and lows. Multiple clean retests of the support line confirm the integrity of the trend, and recent movement shows BTC pulling back from mid-channel after a short-term correction. Now the price is approaching the support area between 102000 - 103000, which aligns with the channel’s lower boundary. Given the pattern’s consistency and strength in previous rebounds, I think BTC can correct to the support line and continue to grow. For this case, I set my TP at 113000 points, near the resistance of the upward channel. Please share this idea with your friends and click Boost 🚀

BITCOIN Free Signal! Sell!
Hello,Traders!
BITCOIN made a breakout
Of the long-term falling
Resistance line and then
Hit a horizontal resistance
Level of 88,860$ so we will
Be expecting a local pullback
From the level which means
We can enter a short trade
With the Take Profit of 85,297$
And the Stop Loss of 89,061$
Sell!
Comment and subscribe to help us grow!
Check out other forecasts below too!
Disclosure: I am part of Trade Nation's Influencer program and receive a monthly fee for using their TradingView charts in my analysis.

DOGE vs BTC: MACD DivergenceHello,
They may bothe be dropping against the inflated dollar, but this indicates that DOGE is becoming stronger in the battle of David vs Goliath. Thats me… im Dave, and Doge is the coin that I am manifesting will lead us into the 5D world of the new earth. I believe that BTC is grossly tied to the corrupt money markets… and that DOGE will remain the favor of crypto investor’s hearts.
I believe that the crypto world will pull the biggest pump and dump of all time on the corporate / military industrial complex, and walk away from BTC, leaving them with an empty bag of old school blockchain tech.
This double stacked MACD DIVErgence corroborates this awareness of hte future.
I remember form last time (not in this linear life) that Doge bites BTC on the way off the cliff…. But let’s go and shakes free of the mammoth Goliath of crypto as it crumbles! I remember the way it felt before…. And i know im on a higher vibrational level this life. Surrendered to love. And Doge invokes the emotion of … Unconditional Love.
As more of us gain these awareness, we will see a massive migration of wealth from BTC, and its evil little step sister ETH, over to DOGE. Cause it represents the hard earned work energy credit of the common person here on earth. There is not blood of war on the doge books.
Oh… my MACD observations are color coded for you.
If you want to see what DOGE is doing Ont eh long range… check the linked post i put up yesterday… ish…. Within the last sleep cycle or two anyhow.
Sending Love, and a reminder of the only true universal law on earth:
May All beings live happy and free and may you cause no harm by action or thought to to any living being, or their belongings.

Bitcoin’s Next Big Move: Breakout Incoming or Crash Ahead?Hey, traders! 👋 Welcome back to another deep dive into the markets. Today, we’re analyzing the daily chart of Bitcoin vs. USDT (BTC/USDT) because this week could bring a major turning point! 🔥
What’s happening on the chart?
First, take a look at these two key horizontal levels:
Support at $91,445.18 📉
Resistance at $99,763.08 📈
The price is stuck in this consolidation range. This is a critical moment because when Bitcoin consolidates like this, something big is about to happen! 🚀 Either we break to the upside or head lower. 😬
What are the possible scenarios? 🤔
I've outlined two potential outcomes:
Bullish breakout: If the price breaks above $99,763.08 with strong momentum, we could see a move toward $108,261.81, which is the next major target. 🎯
Bearish breakdown: If the price loses support at $91,445.18, we might be looking at a deeper correction. But hey, no need to panic yet—this isn’t confirmed. 🛑
RSI: The silent indicator 📉
Let’s look at the RSI (Relative Strength Index):
It’s sitting at 48.25, right near the neutral zone. This tells us the market is undecided for now—neither overbought nor oversold. ⚖️
If RSI moves above 50, it’s a sign that bulls are gaining control. On the other hand, if it drops below 40, the bears might dominate. 🐻
Volume never lies 🔊
Volume has been declining during this consolidation. This is typical because big moves usually come after a period of low volume, and then—boom! 💥 Price explodes in one direction. Keep an eye out for a spike in volume to confirm the next big move.
What should we do now? 🧐
Be patient: Avoid trading inside the range. Wait for the price to confirm a breakout above resistance or a breakdown below support.
Look for confirmation: Watch for a volume spike and candlestick patterns near key levels to validate the move.
Have a plan: Set clear targets and stop-loss levels. Remember, Bitcoin can be unpredictable, so stay prepared. 🚀
That's it for today, traders! If you found this analysis helpful, follow me here on TradingView and leave a like 👍 to give this idea a boost. Your support inspires me to keep sharing more insights and strategies. Let’s keep building success together! 🚀💹
Disclaimer:
This video is for informational and educational purposes only. It is not financial advice. Always conduct your own research and consult with a licensed financial advisor before making any trading or investment decisions. Trading involves risk, and past performance is not indicative of future results. Invest responsibly.

BTC - 1H Quick scalp opportunityIn this falling wave, BTC has made a slight correction, presenting a great chance for a quick sell. I'm targeting a swift drop.
Stay tuned for updates! 🎯💹

Bitcoin Bullish count up.If you find this information inspiring/helpful, please consider a boost and follow! Any questions or comments, please leave a comment!
Reacting and testing level identified.
Bulls need to break this level (63380)
and the pivot (65k) as a show of force.
Here is my conservative take if an impulse completes.
All hinges on 61779 and (1) pivot holding.
Possible ZZ completing so looking for a reaction off most likely targets.
One reaction is given. Looking for an impulse down.
Trade Safe,
Trade Clarity.

BTC is very bullish...Bitcoin, after breaking out with a 6-month candle, gave two green candles ahead! So you can imagine why the next 6 months are the most bullish!
#Bitcoin

BTC 15K to 73K, the beginning of the HOLDER dream pre-Halving!!
1. BTC is trading around 72.5K, surpassing its **all-time high (ATH) of 69K.
2. From its minimum around 15K, the original cryptocurrency has appreciated by 383%.
3. BTC HODLERS have experienced significant gains, with most of them currently in a profitable situation.
4. The critical question that arises is: **When will be the right time to sell?
The Crypto Community Profits After the Longest Bear Market in History
They say that after a long wait, substantial benefits emerge. And this is precisely what's happening in the crypto world. Traders, HODLERS, and crypto investors have weathered one of the worst bear markets in history. Many abandoned ship before it sank, but the wisest persevered. Their incredible profits today are a testament to their tenacity and patience.
Technically, BTC/USDT is on an upward trajectory since the 42.5K mark, appreciating by 73% from that level. Corrections will continue to weed out inexperienced traders who jump in during bullish market conditions, but the bullish targets remain steadfast.
1st bullish target: 80K
2nd bullish target: 120K
3rd bullish target: 150K
4th bullish target: 185K (only if it closes above 150K and that level becomes support; otherwise, it could signal the start of a new BEAR MARKET)
Regarding support levels, as long as we remain above the ATH (69K), the bullish trend remains secure. Additionally, if BTC enters a sideways phase and BTC DOMINANCE starts declining, it might be the perfect moment for ALTCOINS to continue their upward trajectory.
Remember: This is not investment advice and should not be taken as such. Each individual is responsible for their actions as a trader or investor.

BITCOIN IS READY Cycles remind us that change is a constant companion on our journey, offering us the opportunity to evolve, adapt, and thrive.
#BITCOIN

Falling Wedge, wait for breakoutChart 1H TF
I figured out a reversal pattern, Falling Wedge.
This pattern combines with Support zone around 1.7 that is very good for reversal.
So wait for a signal to confirm this pattern

BITCOIN BTC Bearish Possibility, Not Much To See Here!Has BTC exhausted its recent rally? Top has rounded and formed, Making lower lows and lower highs, Hitting key resistance, Has failed to sustain 50K, Momentum indicators divergent, and could be following my wave analysis for a pullback.
Still need to see price break 46.5k, 42k and 37k in my humble opinion. After that not much stopping it other than 23k and 16.5k
Just a simple idea analysis. Not much to see here.
Always be ready for any scenario!

Bitcoin nothing to worry about.Path to 80kBitcoin is still on its way to 50k and then 80k. However 25k proves to be a very strong resistance mark due to the 200EMA in the weekly being located there causing an inevitable correction on the lower time frame. Until we are able to break we will be correcting. For the meantime 19-20k seems like a reasonable target If it doesnt go up from here soon.
I am sharing these ideas so my member can see. I don't explain much in here.

BTC (Y23.P1.Video.6). Something like this makes senseHi Traders,
Here I talk about mostly Bitcoin, and the 3 scenarios at hand and give you reasons based on known chart elements.
We also look at how its correlated with the #DXY and #SPx #spx500
Please give me a like and share,
Regards,
S.SAri


Drop to $14,000 for Bitcoin SoonI cant predict or know how price will go but I have a strong feeling we wont be making any more highs now, this pump was the highest we will see bitcoin for a while. We could see another pump but I would short.
I highly doubt we will break above the white semi circle as there is strong rejection from those levels.
NFA, do what you believe at the end of the day.

LTO / USDT | full detailed trade#LTO/USDT
🟢Entry price: 0.073 - 0.07
🎯Targets:
|> 0.081 (Sell 50%)
|> 0.089 (Sell 30%)
|> 0.095 (Sell 20%)
🔴Stop-loss: 0.0675 (4D candle Close under it)
➡️Recommended risk: 0.25%
➡️Recommended Position Size : 3%
please note that due to the current market situation this trade signal is considered risky, so we must stick together to the stop lose and risk management strategy and not to gamble with our money.
stay safe and trade safe
thank you!


BTCUSD BUY lond postion is done all ready , operertunities, need to wait.. create new liquidity , or rejection from borth side..so wait . i want tell you one thing, markets will not gone have huge moves, batter to be speculator not investor. be intelligent speculator.
money is really sticky .

CRYPTO MARKET UPDATE!!! WHAT TO EXPECT THIS WEEK?Hi Snipers,
Please refer to the recording for the next price levels and scenarios.
Thanks
MS

25.2-25.5K seems interesting for new short positionMorning folks,
BTC goes with our long-term fundamental view and those who read our monthly reports knows about it since December 2021 when we've warned against long-term investments in BTC. This week end we have taken in-depth view on the US stock market that shows bad perspectives and BTC as usual is becoming a storm crower, with 600 Mln+ positions were liquidated just on Friday...
In short-term it seems that 25.2-25.4 resistance area might be interesting to consider another short position. Right now we do not consider any longs by far.

Bitcoin trading setup short limit 24300Bitcoin trading setup short limit $24300
TP - 23000
SL - 24700
LIMIT - 24300

Bitcoin (BTCUSD) More Huge Selling Coming What we are looking on Bitcoin are more continuation patterns
The outlook suggest a breakdown to 18k now or a pullback into the 35k range first to suck in more liquidity then sell down to 18k
20k is the Key Level or real trading range but we expect an overshoot into the mid 18k before popping above 20k
Macro view we have our super obvious head and shoulders with a huge Bear flag asking for lower prices.
The Bearish Pennant forming at the 30k isnt a strong probability pattern so nothing to get excited about and hence why we still have 35k on the map, but the rug pull is most likely still coming and what were planning for.
Price has struggled with the 30k level for a while. Not a good sign for the bulls.
Note: 18k/20k is NOT a strong level. Dont expect that level to hold very long when we reach there. 8-12k is the next real region for BTC. As we move into this recession/depression Its not going to favor tech stocks and crypto. However we are excited to accumulate at the bottom to begin the eventual new cycle.
