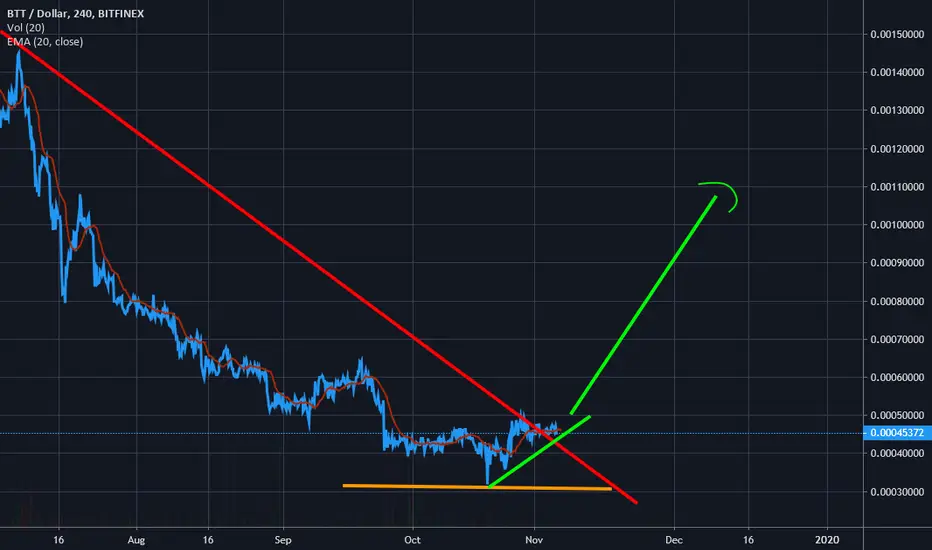
BTT/USDT TA Update (Big Bullish Pattern?)BTT/USDT
BTT is getting ready for a bigger trend reversal of this potential Head and Shoulder pattern. If we can break bullish of this trend-line in the coming few days, we can say that the temporary bottom is being set
and the next thing it will finish is the Right Shoulder of the pattern to completely change the daily trend and quickly shift momentum to the north side.
Bttusd


BTT/BTC TA Update (Ready for Breakout?)BTT/BTC
BTT is still traveling inside this bullish falling wedge pattern for quite some time now. The price keeps respecting them both downward channels,
We can see some bullish signs that this pattern is nearing the end and ready for a large breakout. If BTT can hold the immediate support area around 400 sats
and consolidate for at least a week. That will signal a potential 1st Higher Low before it will have a chance to finally break bullish. Volume is also starting to increase
before it reaches the apex of this pattern which is also added a factor that accumulation is almost done. I'm bullish and already bought some bags for the mid-term trade.

BTT is breaking out!As we look at both the daily BTT/BTC and also the BTT/USD charts we can see that BTT has finally broken its downtrend on the daily chart. There is plenty of room to run on this one. Fib levels and areas of interest for potential targets marked in purple.

BTT/BTC TA Update (Breakout of Falling Wedge?)BTT/BTC
BTT is starting to show signs of buyers are step-in. Big amount of bull volume, multiple touches of the down-trend line support of this falling wedge (Bullish Pattern).
If price can hold new support at around 440-400 sats in the coming days. I expect potential upward movement as it shows bears are already exhausted to send the coin lower.

BTT/USDT TA Update (Double Bottom Reversal?)BTT/USDT
BTT has finally found the bottom? Too early to say that but there are signs that Whales are starting to step in. 1st thing I noticed is the green volumes that we haven't seen for months.
Potential Double bottom and RSI divergence are also another sign. But the overall price action I'm waiting for is to get above 3500 sats and hold it.
Because it will invalidate the descending trend-line of resistance coming from Feb - Mar trading action.
let's find out in the coming days if BTT will change its wind direction.


BTT Price begins to rise slowlyPrice begins to rise slowly. It seems that we are at the beginning of the growth phase)


BTT TO RUN TO NEW ATH (REVISITED) Here is a revised version of my BTT analysis. We see multiple similar touches to the downwards slanting resistance. Please feel free to comment. Even if you are a scummy piece of trash.

BTTUSDT hitting the support of channel | A good long opportunitySince 25 Nov the price action of BitTorrent / US Dollar is moving within an up channel.
Now the priceline is hitting the support of channel.
The priceline is also getting bounced from 50 simple moving average.
The channel support and 50 SMA can be used as stop loss in case of complete candle stick closes below these supports.
Regards,
Atif Akbar (moon333)

BTT dry spell at an end?Has the downward trend ended and is the big move towards the upside coming?? :)


BTT TO RUN TO NEW ATH!!!Here we have BTT with what has been a brutal retrace following a nice run-up. The similarities between the two cycles cannot be ignored. Similar to the last cycle, we have bullish divergence on the RSI, a decreasing price making a lower low while the RSI posts higher lowers. A big move is coming, and given how young this coin is, it has the potential to move fast. Tell me what you think, even if you are a scumbag from the dirtiest parts of the internet. Even if you have kissed your sister, I want to know your opinion.


BTT chart shows a strong upward trendBTT chart is showing the strong upward trend. As per technical analysis , BTT has already reached to its IEO price and it is the best chance to make an entry.
In couple of months BTT can give 50% profit.

Big analysis for btt/btcBtt/btc analysis
Best buying zone from : 4~5 Satoshi
Target 8~9 Satoshi
And it will dump to 1~2 Satoshi after hitting the target

BTTUSDT has hit the channel support | A good long opportunityPriceline of BitTorrent / Tether US is moving within a down channel and has hit the support now turning bullish.
MACD is turning bullish.
RSI is oversold.
Stochastic has given bull cross.
I have defined sell targets using Fibonacci sequence:
Sell between: 0.0005498616 to 0.0005938
Regards,
Atif Akbar (moon333)


BTTUSDT has formed bullish BAT pattern| Upto 119% possibilityPriceline of BitTorrent (BTT) / TetherUS has formed a bullish BAT and entered in potential reversal zone.
I have used Fibonacci sequence to set the targets as below:
Buy between: 0.0008680 to 0.0007410
Sell between: 0.0011709 to 0.0016238
Regards,
Atif Akbar (moon333)
