Btusd

13 candles inside current bear flag, break will happen soon.My last idea about the descending wedge and the bearflag we are currently in I realized I didn't update my current support/resistance zones and their numbers so I decided to make another idea reflecting the most updated support and resistance line information. current Resistance is the tline and just above that the top dotted red trendline of the bearflag, current support is the blue fib retracement line and below that the bottom dotted red trendline of the ebar flag and also both tan trendlines of the descending triangle could offer support. We are now 13 candles deep into this bear flag this is a long one but usually we see a breakout of a flag around the 6th candle so I expect a breakout sometime soon within the next 2 4 hour candles.....I'm greatly hoping for a break upward but both upward or downward are very much plausible which is why for now I remain neutral.

Bitcoin holds Weekly resistance11500 was the key level. The last move down did not quite get to my target of 5k but I am still long term bearish. Price came back up to a major weekly Ichimoku resistance and held last week. If this move follows through it could continue all the way down to my afore mentioned target. I've effectively hedged my Bitcoin holdings at this point to be delta neutral with a slight positive futures premium. It's unfortunate that the days of 18% futures premiums are for now history.

4Hr TF lives a buy signal and bullish 4Hr TF lives a buy signal and bullish
We can expect a bullish cross over of 50 EMA and .5 Fibo level to

10,9,8,7,6,5,4,3,2,1 Ignition! Warning last Call before BTC MOONCan you see what happen in December ? Even though there will be a little sell off for now we will have a Rocket that is very close to start their engines...
right now only the fuel is filled into the tanks of (BTC) ! hell yeah!

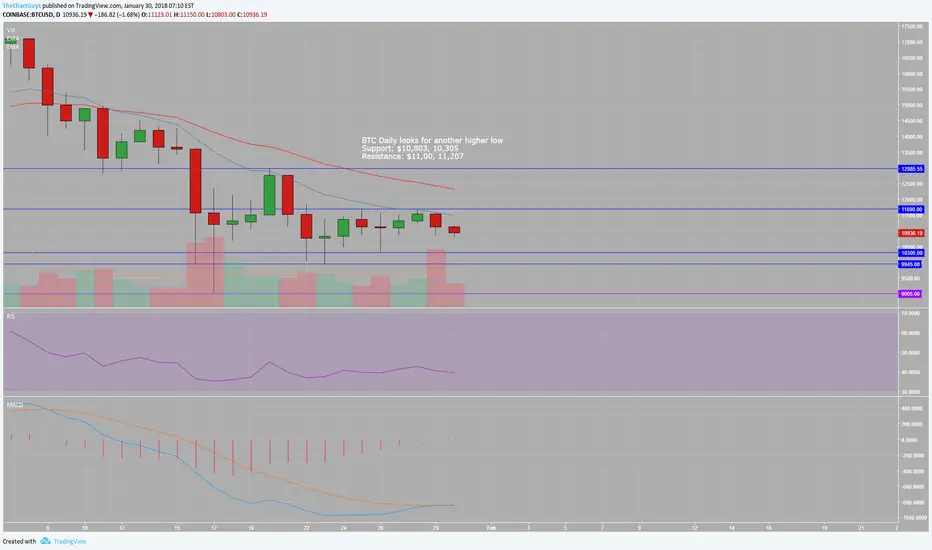
BTC Searching for Daily Higher LowBTC GDAX double top over the weekend kept the bulls in the daily tightening pattern.
Weekly chart is looking set to give us a 2nd inside bar in a row.
We will be looking for a higher low on the daily today or tomorrow, but short term gains for bulls unlikely to be significant until we breakout from this pattern.
Up to bulls to prove themselves and shift momentum, as the bears have the upper hand on the daily trend.
This is a game of patience as we will likely see volatility in the sector pick up in February.
Stay patient and picky for trades while in the tightening daily range.
BITCOIN - THE MOVE TO $15,000 / RISING WEDGE.The Bitcoin price has gained some bullish momentum ever since the last catastrophic decrease that hit the market, according to the graph we could see some further bullish action coming it's way, however, from the graph we have got some bearish patterns that may be indicating otherwise. A lot of people have been speculating that prices may fall to $8,500 as a major support, I would not believe that to be true. The rising wedge on this graph should be closely watched in coordinance with the resistance (indicate by the orange line), this will signal whether we are about to break up or break down.
Rising wedges are typically bearish, however, there is a chance we may break above the tension and pop through the resistance which may end up in prices heading back to the $15,000 area.
MACD - Not added to this analysis as on the timescale it was not showing any relevant indications that you want to take into consideration.
RSI - Not added to this analysis as on the timescale it was not showing any relevant indications that you want to take into consideration, however, it was nor oversold or overbought but was still circulating in the higher section which usually is a bit bearish.
Orange - Resistance.
Pink - Support.
As always trade the lines accordingly.

BTCUSD (BITFINEX): flag pattern on 4 hour chartThe two purple trendlines form a flag-pattern
if a breakout to the below follows, the price target would be rougly USD 4648
However, price may find support around USD 7626


BTCUSD Short Term to end of MayProbably silly to guess on such a short time frame but I am hoping something of this shape plays out based on the form and speed of the prior movements and the way the Ichi Clouds and MACD have been 'interacting' with those movements.
Also, looking at Bitfinex cold storage wallet balances. Seems to have a temporary correlation to price.
