Bullflagpattern


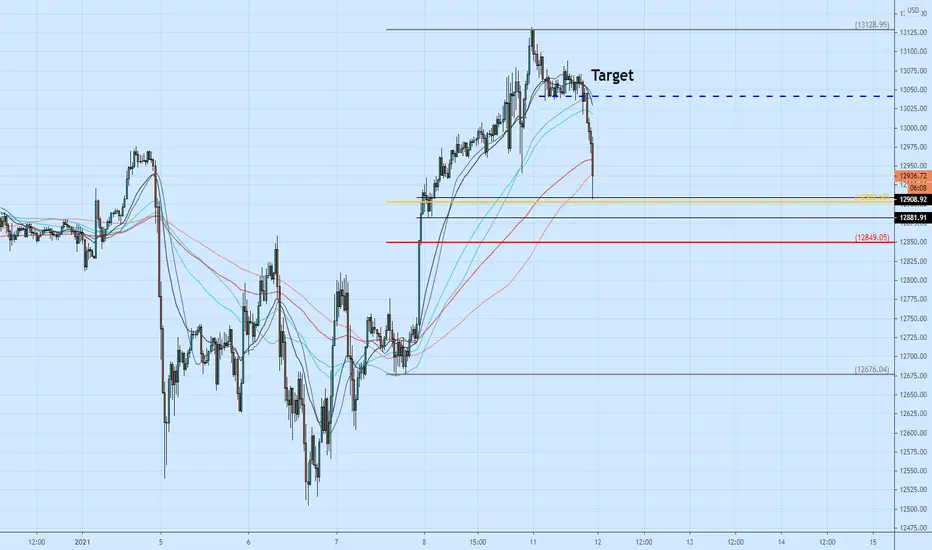
bullish setup of NQ on 30m(bull flag pattern)The zone has already been touched. It's a bit aggressive cuz my setup was based on 4H. From the 30m/15m/5m, I didn't spot any reversal pattern yet.
So this is not a confluence trade. We only got the 4H and trend on our side. No price reaction on smaller tf yet.
Be cautious! First target should be 1:1, and then trail your stops.
Bullish Pennant for Bitcoin?Bitcoin has been creating so many moderately predicable bullish patterns, however, it's tricky swing trading due to fake-outs occurring regularly.
Clearly, BTC is trading in a Bullish Pennant, however, that's always subject to change if the green upward sloping support of the pattern doesn't hold. I have colored the bullish pennant green for ease of visualization because I like leaving previous patterns on my chart to get a sense of the Macro trading environment and areas of confluence, looking back at patterns in hindsight can be a learning experience, no matter how good you are at trading there's always more to learn, especially trading crypto.
RSI is showing a descending triangle with a noticeable bearish divergence. since Jan 5th we've seen the price rise but the RSI traded sideways and downward creating lower high after lower high... It's very likely the bulls defend the bottom area of the descending triangle, expect a bounce near term.
The KST's seen a bearish cross & is trading in a not so perfect descending channel, I am expecting a bullish cross near term because we're oversold and it would characteristic given the trend thus far.

SIEMENS - Bull Flag Breakout with Good Volume support - SwingThis analysis is done purely on basis of price action and chart patterns
Analysis is done on Daily TF hence it may take few days to few weeks for price to reach the given target.
This is not a trade recommendation. Do your own study before entering into any trade.
Trade with your own risk & money management.
Feel Free to comment for any query or suggestion.
Check below in the image, the previous idea/set up in the same stock (for understanding another price action chart pattern.


RLCUSDT is testing 4h resistance 🦐$RLC.X IF the price will have a breakout from bull flag, According to Plancton's strategy (check our Academy), we can set a nice order
–––––
Follow the Shrimp 🦐
Keep in mind.
🟣 Purple structure -> Monthly structure.
🔴 Red structure -> Weekly structure.
🔵 Blue structure -> Daily structure.
🟡 Yellow structure -> 4h structure.
⚫️ Black structure -> <4h structure.
Here is the Plancton0618 technical analysis, please comment below if you have any question.
The ENTRY in the market will be taken only if the condition of the Plancton0618 strategy will trigger.

Gold bugs, we took a huge hit today...Nice day for the dollar, non-ideal for us in gold longs. Gold took a steep dive today.
Why?
Jobs report did not come out hot indicating the recovery is going to take longer potentially
The dollar actually rose today, and I am assuming that this was driven a bit because of the jobs report.
TIP also dropped today (iShares TIPS Bond ETF)
People may be pulling out of gold into risky assets such as Bitcoin ... Tesla?
Some things to keep in mind here.
My thoughts on Gold
Strong day for the dollar
Still appears to be creating a mega bull flag
Strong macro factors at play
Rates low for years, and I commented earlier that the FOMC targeting 2% is not going to be an inflation expectation to cause a parabolic run in gold, but when viewing the yields on holding digital dollars like CircleVisa's USD Coin (USDC now has a market cap aiming at $4 billion) we see yields being offered for holding this dollar at 1-1 parity with US Dollar yielding rates of 7-10%. This I think is a good indicator of where real inflation somewhere is.
Gold bugs have the gold salesman Peter Schiff converting Bitcoin bulls to get out of crypto & into gold ... /sarc :)
In reality I wonder if we are seeing an exodus out of gold into the growing market cap of bitcoin. The utility of Gold is to preserve wealth against inflation, while bitcoin is literally in a state of being parabolic right now. (Love BTC and am also heavily long it)
New administration will no doubt be providing added easing/stimulus

BNBUSDT 45$ soon? 🦐$BNB.X had a breakout from a bull flag, and now the price is testing 4h resistance, IF the price will break the resistance According to Plancton's strategy (check our Academy), we can set a nice order
–––––
Follow the Shrimp 🦐
Keep in mind.
🟣 Purple structure -> Monthly structure.
🔴 Red structure -> Weekly structure.
🔵 Blue structure -> Daily structure.
🟡 Yellow structure -> 4h structure.
⚫️ Black structure -> <4h structure.
Here is the Plancton0618 technical analysis, please comment below if you have any question.
The ENTRY in the market will be taken only if the condition of the Plancton0618 strategy will trigger.

SHREECEMENTS - Bull Flag + Double Bottom - SwingThe above analysis is done purely on basis of Price Action & Chart Patterns.
The analysis is done on daily TF hence price may take few days to few weeks in order to reach the targets
As can be seen in the image, price has given clear breakout from Bull Flag Pattern with good volume confirmation.
Breakout from Double Bottom pattern is yet to occur.
Entry can be made above the high of breakout candle. SL and Targets are shown in image itself.
The above analysis is purely for educational purpose. Traders must do their own study before entering into any trade. Traders must trade as per their own risk taking capacity and money management.
Feel Free to comment for any queries regarding the above stock or price action analysis in general.
Also check out my other ideas to understand how price action works and how it can be used to make regular profits without any complex strategies.

GOCO Double Bottom/Bull FlagDouble Bottom has already formed and transitioned to a Bullish Flag which has just experienced a price breakout. We could see some really nice upside to $18-$19. In the mean time watch price action and volume .


$ALPP Bull Flag: Huge stock rally coming?!Alpine 4 Technologies. OTC:ALPP
Your comments are welcome.
##############
Legal disclaimer: I am not a financial advisor. The advice here given is not a financial advice even though my excitement might make it look like such. This account shouldn't be followed by anyone expecting something from me. You trade at your own risk and nobody can guarantee you results. Even if someone could, I don't.

Apple on the verge of a massive flag breakoutNASDAQ:AAPL
Apple is on the verge of a massive upside Bull Flag breakout on the 1W chart. Price is currently above the 200 Day SMA (historically bullish) and if we look at the weekly trend and don't fight it, we can see that the trend is currently clearly up.
I see this flag breakout as a bullish continuation, with the ultimate price target being $220 (height of the flag pole). Couple this technical picture on a HTF chart with Apple's amazing fundamental tailwinds in the next 6-12 months (5G super cycle), I see us hitting the $220 target by Q1 2021.
Not financial advice, but I will be positioned with long-term calls and adding to my overall investment portfolio here.
- PennyBag

Weekly Outlook(patterns to watch)$QQQ $EA $MCD $CMCSA $GLD $LAZRHere, I go over a few patterns I am looking at for the coming week, It looks like we have a few good set ups to start us off for the new year!


Bullflag Breakout?Watching carefully here for CMCSA to breakout of a bullflag at all time highs. Great consolidation and we also see some bullish divergence on the RSI

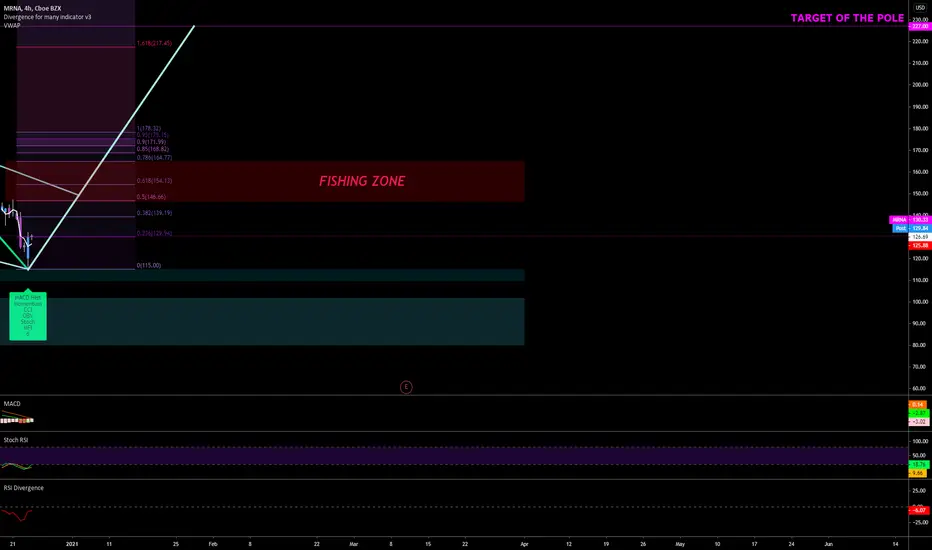
Moderna is Bull Flagging! Target 227$ Moderna is currently on a bull flag.
Last retracement is very positive. The breeder finally came and there is still some place to lower around 110$ where the bottom of the gap up is ! I would not be surprised is MRNA go there but usualy if the bull trend continue the daily MA 21 will offer support and this is currently what we are seeing. Daily MA 21 is at 125.78$. Price came back over the daily Vwap today.. this can push the price quicky around the fishing trap zone around 154.13, but 146.46$ should offer a good resistance. MRNA is in a great posture for a continuation right now...
Here are some key points to watch :
-Currently on a potential Bull Flag with a target over 200$
-Bullish divergence on the 4 hour chart on MACD, Momentum, CCI, OBV, STOCH and MFI.
-Support seem to be strong on the daily MA 21
-Price now over VWAP which is now support at 126.69
-Stoch RSI is crossing on the upside on the 4 hours
-Weekly MA 7 and MA 9 offer support at 127.72$ and 114.89$
-4 hours MA 21 offer support at 126.69
-RSI is turning on the upside
-Daily MACD is still in bullish territory
-Bottom of 4hr Donchian channel reached at 115$
-Bottom of 4hrs and 1day chart Bollinger Band reached
-Bottom of Donchian Channel is at 98.65$ (can the price go there) Maybe but!
-Median line of the weekly Bollinger Band is at 89.23$ (can the price go there) Maybe but!
Merry Christmas ! Much love!
GRT/USD Possible play for the coming weeAs GRT continues trading with a high-volume on exchanges it is still a trader's favorite in this month. We are currently retracing from the bounce from .32 to .49. This could be the beginning of a new trend upwards.
The current retracement from .49 to .39ish has created a possible bull flag. If this is true we should be testing the highs of .49/.50 again.
The resistance at .50 is pretty strong, I see us hitting it within the next few days or so and then retracing back to .45 before making our way into .50s -- .60s levels.
All this depends if the bull flag at .38 - .40 is true.
We should have an answer within the next 24h-48h.

ICICIGI - Bull Flag/Pennant - Short Term SwingThe above analysis is based purely on price action & chart patterns.
The analysis is done on 60 min TF, hence it may take price to reach the targets in few days to few weeks.
Trade setup along with Entry levels + SL & Targets are given in image itself.
Traders must do their own study before entering into any trade. They must trade with their own money & risk management.
Feel Free to comment for any suggestion or query regarding price action analysis.
Checkout my other ideas/charts to understand how chart pattern & price action works.

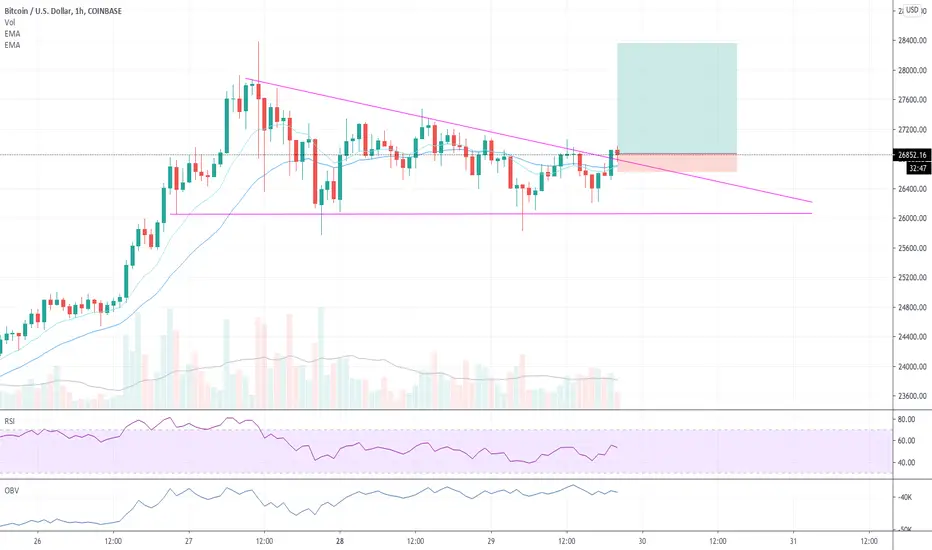
#Bitcoin : Possible Bullish Setup, a quick update.Clear Bull Flag Pattern on Bitcoin, the Bull Flag hits its target around 70-80% of the time and is one of the most reliable patterns to trade in parabolic bull markets.
Often the best entry point on a Bull Flag pattern is when the price "fakes out" underneath the flag support before the real breakout occurs.
22300-22500 we need to hold as support for it to continue up in the short term which is the flag support also, as long as we dont lose that area we have a probability of continuing up.
If we can see a breakout of resistance at 23900 the next target area is 25400-26900.

Litecoin Equidistant Channel | Parallel Channel Target Price 124.50 | Litecoin Equidistant Channel | Parallel Channel
