had a nice move today, hourly chart bull flag -- to move highersee fib levels.
*remember we are in the middle of filling a gap.
~the trend is your friend~
Bullflagpattern

GWW 1H Upcoming Bull Flag GWW possible bull flag in 1h 4h and daily, has som time to move down and then pop. Feb earnings if positive could be the ATH tester.

INFY - Ascending Triangle + Bull Flag - Swing/Short termThe above analysis is based purely on price action & chart patterns.
The analysis is done on 60 min TF, hence it may take price to reach the targets in few days to few weeks.
Trade setup along with Entry range + SL & Targets are given in image itself.
Traders must do their own study before entering into any trade. They must trade with their own money & risk management.
Feel Free to comment for any suggestion or query regarding price action analysis.

EURUSD on a bull flag 🦐EURUSD after the last impulse until the 1.22700 retraced back at the 0.5 fib level inside a channel.
The price tested the previous resistance, now support, at the 1.21600 and bounce over it.
IF the market will break above the structure and consequently break the channel we will set a nice long order according to Plancton's strategy.
–––––
Follow the Shrimp 🦐
Keep in mind.
🟣 Purple structure -> Monthly structure.
🔴 Red structure -> Weekly structure.
🔵 Blue structure -> Daily structure.
🟡 Yellow structure -> 4h structure.
⚫️ Black structure -> <4h structure.
Here is the Plancton0618 technical analysis , please comment below if you have any question.
The ENTRY in the market will be taken only if the condition of the Plancton0618 strategy will trigger.

Ripple - XRPUSDT 4H oversold & bull flagRipple - XRPUSDT 4H oversold & bull flag
- Lowest 0.34$, pull back to 0.43$ or 0.49$
- Make stop loss 0.33$


NATURAL GAS 1D BULL FLAG LONG TRADEBull Flags are a Range which are repeatable trading chart patterns.
Bull Flags are a descending chart pattern which will have a directional bias (Long) depending on the previous incoming trend.
Each chart pattern will have defining trendlines of the support/resistance levels creating the pattern.
What ever time frame you are trading this chart pattern, wait for a candle close outside of the trendline in the direction of the breakout candle. (Our time frame preference is the Daily chart).
Add volume indicator - Volume is the amount of $ that went into a particular candle or in Forex the # of trades that took place.
Add ATR indicator - Volatility is the amount of price movement that occurred. Use the ATR to measure the price movement.
When you see descending Volume bars and descending ATR line (which indicates volatility) this shows
a dis-interest in traders to invest in this pair creating consolidation which creates the chart pattern.
Trade Management after there is a breakout candle close.
1 - Position size (compare volume bar to volume ma line).
a - Breakout candle must be 100% of volume average for a full position size.
b - If 75% of volume average then ½ position size. (To find 75% of Volume
look at the charts volume settings – divide smaller # into larger # = 75%+)
If not 75% then stand aside from the trade.
2 – If candle breaks out of a trendline, 15m before the close of the day prepare your buy/sell order.
Enter two trades. 1st trade will have a SL & TP. It will close automatically when the 1st TP is hit. 2nd
trade only has a SL and will be allowed to run. When 1st TP is hit move the SL to breakeven. Look
at ATR and prepare SL at 1.5 of ATR. Prepare 1st trade TP at 1 of ATR.
3 - SL for both trades will be 1.5 x ATR.
4 - 1st trade TP will be 1 x ATR.
5 - No TP on 2nd trade – letting profit run and adjusting SL to follow price.
6 - When 1st TP hit – move 2nd trade SL to breakeven.
7 - Adjust the 2nd trade SL to follow price.
*8 – After Breakout candle – if price closes back into chart pattern close trade don't wait for SL to be hit.
*9 - When breakout candle is more than 1 ATR from breakout candle open.
a - Enter 1st trade at candle close with ½ position size.
b - Enter 2nd trade with a pending limit order that is 1 ATR of breakout candle open.
c – Price should pullback to that pending limit order for 2nd trade.
d – If Price returns back into chart pattern close trade before SL is hit.

Bitcoin possible bull flagHello!
Has been very interesting to watch how BTC performs now on All Time High.
Here we have a nice setup. Ready for both moves up and down.
Fear And Creed Index 95 and have been on or close to extreme creed for more like 1,5 month ;D. So we are going to see a drop. The question is. Is it in a week or after another month. Use caution!
Bitcoin broke ATH and is right now on uncertain waters but we are still in strong bull trend (higher lows) . We can see fast moves up or down. I think this is a possible move upside as we can see the smooth flag pattern. Target levels shown as arrows are symmetrical size from the price movements before.
RSI has also already broke the supressing trendline (Bull)
There are also EMAS which might work as a support.
I am ready to take another long (Fibo levels) if the pattern brakes downward.
Keep in mind that this is 1 hour timeframe so it is possibly to just go sideways and the pattern can totally reshape.
Oh yeah I almost forgot. There is also still space to move on Bitcoin Dominance chart on weekly if you check the top resistance line. I think I made an analysis about (3 - 4 weeks back) it before and it did work as resistance.
Let's see where the market wants to go and follow it's lead and peaceful Christmas to everyone!
This is not financial advice.
If you do make trades use stop loss or you get your ass burned.
1st mistake beginner traders do is taking to big risk.
-Jebu

bull flag pattern, bottom of channel+ macd bullish cross looks like it's approach and also appears to be oversold.
* ceo on cnbc mad money tonight. could move on that.

ROSEUSDT created a bull flag 🦐ROSEUSDT created a bull flag and had a breakout. Now the price is testing daily support, if the price will have a breakout from 4h resistance and retest it as new support, According to Plancton's strategy (check our Academy), we can set a nice order
–––––
Follow the Shrimp 🦐
Keep in mind.
🟣 Purple structure -> Monthly structure.
🔴 Red structure -> Weekly structure.
🔵 Blue structure -> Daily structure.
🟡 Yellow structure -> 4h structure.
⚫️ Black structure -> <4h structure.
Here is the Plancton0618 technical analysis, please comment below if you have any question.
The ENTRY in the market will be taken only if the condition of the Plancton0618 strategy will trigger.


BAJAJ-HOLDING -- Bull Flag Breakout - Swing TradeThis analysis is purely based on price action and chart pattern.
Analysis is done on daily TF hence it may take several days to couple of weeks to reach its target. Traders can also take advantage of this analysis in intraday trades.
Analysis & Strategy along with logic is explained in image itself. Entry can be taken at CMP to 3060 range.
Always plan your trade & trade your plan
Keep trailing SL accordingly once entered into the trade.
This analysis is purely for education purpose. Kindly do your own study before entering into any trade .
Feel Free to comment for any suggestion or query about chart study / price action analysis.
check out other stocks with similar pattern breakout in below links --

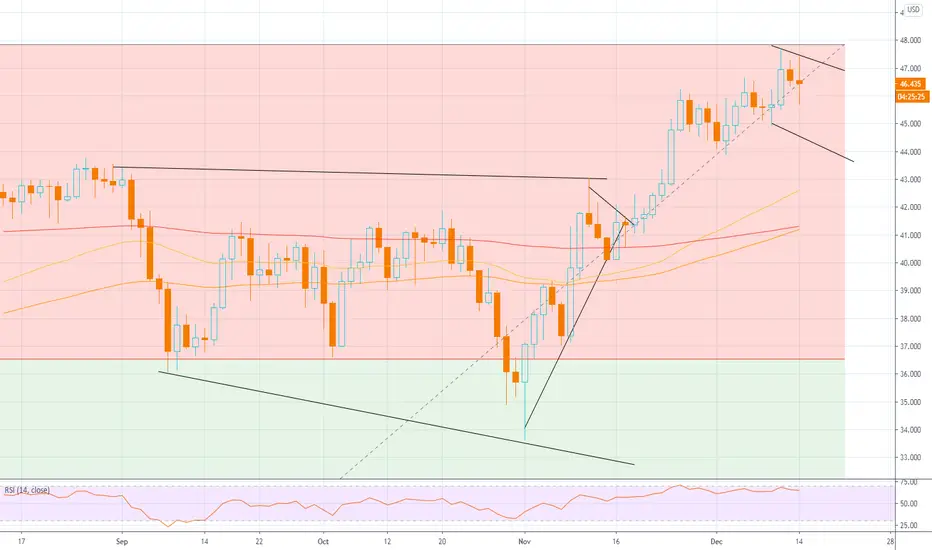
Daily USO - The road to 50 and beyondPossible Bull Flag now in play
Using 4 hr and Weekly
USO has come down a bit, offering traders and investors a chance to pick up Energy Equities or Oil itself at a discount to last week's nosebleed prices. Next hurdle if 47.84 is breached with strength, would be 51.23, which is the 200 W EMA when looking weekly chart. I should not be switching time frames, but we are now above the 200 Daily EMA, I'm going to call it legit. Not for the feint of heart this week. Prices can still go lower. I would consider 41.38 as absolutely critical last chance support on the Daily if the wheels come off in the next few weeks. Near-term support is 45.97 (50 EMA on the 4-hr). Distribution (selling) occurred at 47.40 which is at the top of the flag formation for today.
I am holding oil & gas equities, along with a leveraged oil ETF (bought at significantly lower prices) and I am not looking to sell, as these are all long-term holds. No interest in adding to the leveraged Oil ETF as it does not pay me, holding for above 50 at the least and I will see where it goes from there, long-term target could be as high as 70, but this could take months. I am using the RSI, and I am tracking what might be the hint of bearish divergence, but not on larger time-frames.
BREAKOUT OF SYMMETRICAL TRIANGLE ON BTC:USD !!!WE BROKE OUT OF THE TRIANGLE AND RETESTED THE RESISTANCE LINE AS SUPPORT. WE ARE MAKING A BULLFLAG AT THTE MOMENT.
IF WE CAN BREAK THE BULLFLAG TO THE UPSIDE WE COULD SEE A CONTINUATION OF THE TREND WITH A POSSIBLE PRICE TARGET AROUND $22100.

EURUSD is creating a bull flag 🦐EURUSD is creating a bull flag on 4h. the price had a false breakout.
IF and on IF the price will have a new breakout and confirm the previous resistance as new support, According to Plancton's strategy (check our Academy), we can set a nice order
Monthly
–––––
Follow the Shrimp 🦐
Keep in mind.
🟣 Purple structure -> Monthly structure.
🔴 Red structure -> Weekly structure.
🔵 Blue structure -> Daily structure.
🟡 Yellow structure -> 4h structure.
⚫️ Black structure -> <4h structure.
Here is the Plancton0618 technical analysis, please comment below if you have any question.
The ENTRY in the market will be taken only if the condition of the Plancton0618 strategy will trigger.

JUST DIAL - Bull Flag (Breakout awaited) - Swing TradeThis analysis is done purely on basis of price action and chart patterns
Analysis is done on Daily TF hence it may take few days to few weeks for price to reach the given target.
Stock is at good consolidation phase and it can be accumulated between CMP and 590 levels.
Trade Strategy as well as SL is given in the image itself.
Target levels are also mentioned in the image itself.
For better clarity on target levels, pls check the second image attached below
This is not a trade recommendation. Do your own study before entering into any trade.
Trade with your own risk & money management.
Feel Free to comment for any query or suggestion.

Bull Flag Forming on XRP 1hr chart?Channel formed with decreasing volume after a high volume bullish impulse. Suggests a bull flag and is confluent with increasing buy pressure from the airdrop hype. Longing at support drawn or at the bottom taps of the channel to reap the potential rewards from a strong rally towards Saturday doesn't seem like a bad idea. Invalidation at clear breakdown of the channel and of support.


ICICIBANK - Bull Flag formation- Intraday/Short Term TradeThis analysis is purely based on price action and Chart Patterns.
The analysis is on 15min TF hence target can be achieved in intraday trade or in couple of days
Trade logic with SL and Target is explained in image itself.
Don't chase the price.
Always plan your trade & trade your plan
Check the idea of ICICIBANK Bull Flag Pattern Breakout on Daily TF linked below.
Keep trailing SL accordingly once entered into the trade.
Trade at your own risk and money management. Do your own study before taking any trade
Feel free to comment for any queries & suggestion

$PBH bull flag pattern complete2nd bull flag appearance for $PBH with 4 months in the making. I bought in on the fakeout @ (3 Nov) and holding til $19.
Topped up just before the breakout. How do I know it's not another fakeout? I used a combination of indicators: Volume, MACD and RSI divergence which isn't shown.
Low risk/high reward.. Just my type 😉

BHARTI AIRTEL - Bull Flag Breakout - Intraday/Very Short TermThis analysis is purely based on price action and Chart Patterns.
The analysis is on 15min TF hence target can be achieved in intraday trade or in couple of days
Trade logic with SL and Target is explained in image itself.
Check the idea linked below to understand the Breakout on Daily Time Frame.
Entry can be made above the high of breakout candle or wait for any retest.
Don't chase the price.
Always plan your trade & trade your plan
Keep trailing SL accordingly once entered into the trade.
Trade at your own risk and money management. Do your own study before taking any trade
Feel free to comment for any queries & suggestion

TATAPOWER - Breakout - Intraday/Very Short Term TradeThis analysis is purely based on price action and Chart Patterns.
The analysis is on 15min TF hence target can be achieved in intraday trade or in couple of days
Trade logic with SL and Target is explained in image itself.
Check the idea linked below to understand the Breakout on Daily Time Frame.
Entry can be made above the high of breakout candle on reversal signs.
Don't chase the price.
Always plan your trade & trade your plan
Keep trailing SL accordingly once entered into the trade.
Trade at your own risk and money management. Do your own study before taking any trade
Feel free to comment for any queries & suggestion

SAGAR CEMENT - Bull Flag Pattern - Swing TradeThis analysis is done purely on basis of price action and chart patterns.
The analysis is done on weekly TF hence it can take couple of days to couple of weeks to reach the target.
Logic, SL and Target is shown in image itself.
This analysis is for study purpose. Traders must do their own study before entering into any trade. Traders should trade with their own risk capacity and money management.
Feel Free to comment for any query or suggestion regarding this stock or Price Action Analysis
