AXSUSDTI see a Bull Flag breakout forming in the Daily chart of AXSUSDT.
Bull flags are usually a continuation pattern but I'm waiting on next daily candle close above the resistance to confirm the bullish breakout.
The volume is increasing with it so it's possible to continue the bull trend it started.
Both my take profits are shown which are major resistance zones.
Bullflagpattern

AXSUSDT is inside a bullflagAXSUSDT is inside the bull flag
A bullflag is a chart pattern that occurs in an upward trending market and is characterized by a period of consolidation or retracement within a parallel channel, creating a flag-like shape. The pattern is considered bullish as it often precedes a continuation of the uptrend.
In this case, AXSUSDT is testing the 0.618 Fibonacci level inside a bullflag formation.
The price has increased 63% since the previous idea after a clear breakout from a descending channel. Additionally, the price created an engulfing pattern on the daily support at the 10$ area, which could be a bullish signal, so According to Plancton's strategy , we can set a nice order
–––––
Keep in mind.
🟣 Purple structure -> Monthly structure.
🔴 Red structure -> Weekly structure.
🔵 Blue structure -> Daily structure.
🟡 Yellow structure -> 4h structure.
⚫️ black structure -> <= 1h structure.
–––––
Follow the Shrimp 🦐

CHAYO | Elliott Wave | Correction Projection - 25%Price action and chart pattern trading
> The current price C-wave correction is moving within a falling flag
> Potentially 4-wave uptrend targeting 0.5 retracement of 3-wave approaching / fakeout SMA200 day resistance zone.
> Entry @ SMA200 breakdown
> Target @ 0.5-0.618 Wave 3 extension zone -25% - 30%.
> Stop @ 8% previous 1-wave correction zone
Always trade with affordable risk and respect your stoploss

KCSUSDT is testing the resistance!KCSUSDT has recently experienced an impressive breakout from a bull flag pattern. The price is currently testing a key resistance level after retesting the 0.618 Fibonacci level. The market appears ready for a potential breakout.
A bull flag pattern is a technical analysis chart pattern that is characterized by a strong upward price movement, followed by a period of consolidation or sideways movement, in the form of a flag or a pennant. The pattern forms as the price of an asset makes a sharp upward move, creating a flagpole, and then enters into a period of consolidation with lower volatility and a tighter trading range, forming the flag or pennant. The bull flag pattern is considered a continuation pattern, as it suggests that the underlying bullish trend will likely continue once the period of consolidation is over and the price breaks out of the flag or pennant formation.

Is the merge the catalyst of the ETH flippening?It is incredible to see the spotlight on ETH as the MERGE is all the talk on Bloomberg and CNBC. This narrative will only get louder as we near the long awaited celebration of POS.
Daily Transactions on network: ETH 1.3m BTC 225k
ESG Goals: ETH will be 99.95% more efficient than Bitcoin. Bitcoin, is still being mined by China Coal - *Bloomberg Citation
Total Value Locked: ETH $34.1b Billion, Bitcoin $0
Staked: ETH has over 11% of circulating tokens staked. Bitcoin has 0 staked on network.
Hodling Rewards: ETH Staking Rewards are estimated to be 5.5-13.2%. Bitcoin does not reward holding with passive yield.
Tokenomics: ETH will be cutting new issuance by 90% (equal to three bitcoin halvings). While burning ETH in every transaction making it deflationary. Bitcoin is increasing supply for another 140 years as the underlying supply inflates. Deflation will decrease supply of tokens making the price of eth rise. Bitcoin increasing the supply of tokens will make the price of bitcoin drop - (Miner pressure). Bitcoin would need to see over $20m of inflows daily just to break even due to mining selling pressure. Just because there is a cap, does not make Bitcoin protection against inflation. Bitcoin itself is inflationary like fiat.
Security: According to the report just released by ConsensSys today, Ethereum's network post merge will be up to 20 times more secure. Eth2.0 is significantly more secure than Bitcoin, as for $3-13 Billion USD (chump change for America/China/UK/Australia/Japan etc) Bitcoin's network could be taken out with a 51% attack. There is a misleading idea that to have a 51% you would need 51% of the tokens, this is incorrect. As for eth, you would need over 51% of the validators. ETH is more secure, as a malicious actor would need to spend billions on acquiring more eth, to then run more validators which would make the price of eth skyrocket ever more. Possible yes? Realistic LOL no, as all the while they will run the risk of getting their staked position worth billions slashed, which again would lead to more eth scarcity bringing the price up ever higher.
Future outlook: Bitcoin is done as upgrades are ill advised. If Bitcoin were to be fixed (POS) the network would fork again as the miners are making fortunes dumping newly created (inflation of bitcoin supply) tokens onto bitcoin holders daily. ETH post merge, has a lengthy roadmap that includes sharding, this will finally tackle the fuel fees (making the cost to use the network significantly more economical), increase scalability, speed and capacity of the network.
The next comparison we should investigate is the trend as far as market dominance is concerned:
Likewise, we can see the recovery in ETH has been superior to BTC. In fact it seems that on days we drop, like yesterday Bitcoin falls harder, while on positive days Ethereum outperforms.
As I stated Ethereum has the Alpha. That analysis is linked below (Related Ideas) for those interested.
Jung stated that for a tree to reach heaven, its roots need to grow to hell. Likewise like everything in crypto: IT WILL EVENTUALLY CRASH
I do not recommend chasing price. I already am long, however I plan to add to the position in the buy zones as labeled below. If we break above the EMA ribbon, I then simply plan on buying even at a higher price & then letting the winner run:
Let's talk about practical utility.:
--> Bitcoin does have use in El Salvador, and the finance minister Alejandro Zelaya said bitcoin adoption has been beneficial to El Salvador's unbanked population. Citation available below.
-->Visa and Mastercard announced settling transactions with the ETH token USDC. " The credit card provider that moves billions of dollars each day in 200 markets today announced it accepted the first settlement payment in U.S. Dollar Coin (USDC), a cryptocurrency pegged to U.S. dollar in a 1:1 ratio, from its global crypto wallet partner Crypto.com over the Ethereum blockchain. " Citation available below.
-->The European Investment Bank (Partnered with Goldman Sachs) issues its first ever digital bond on the Ethereum Blockchain. " The EIB launched a digital bond issuance on a blockchain platform, deploying this distributed ledger technology for the registration and settlement of digital bonds, in collaboration with Goldman Sachs, Santander and Societe Generale. " Citation Below.
--> The Reserve Bank of Australia released the positive results of their research project " The project involved the development of a proof-of-concept (POC) for the issuance of a tokenised form of CBDC that could be used by wholesale market participants for the funding, settlement and repayment of a tokenised syndicated loan on an Ethereum-based DLT platform ." Citation Below
Citation:
China Coal * www.bloomberg.com
El Salvador Finance Minister www.bloomberg.com
Visa Will Start Settling Transactions With Crypto Partners In USDC On Ethereum www.forbes.com
The European Investment Bank Digital Bond www.eib.org
Reserve Bank of Australia Public notice www.rba.gov.au
Project Atom Research Paper www.rba.gov.au

Bull Flag trading Long Silver HUGE MOVEAll details are on the chart.
This is the weekly chart for Silver. From left to right, you can see that Silver consolidated for 2.5 years before it started the big move Upwards in 2019.
Price dip in March 2020 with COVID as everything else then it recovered to make a HUGE MOVE to ATH (ALL TIME HIGH) of ~79000.
Since then, Price has been consolidating in a Channel for ~2 years now and it has a beautiful Bull Flag Pattern that has formed.
You can see in the round green circles i drew in the top of the channel that price has already tested that area 4 times. From my experience, the more a Resistance or Support is tested, the weaker it gets.
All eyes are on a Recession for 2023 and in all Recessions, metals goes up big time.
Unless some external forces save us from Inflation and Recession, history will repeat.
If we look into the charts, the pattern also tells the same thing. Bull Flags are 67% accurate when they break to the upside so as for possible Targets, you can see that Target 1 is half way the distance of the Flag pole which also coincides with the width of the Parallel Channel. That is a great Target 1. Target 2 will be the move of the Bull Flag which is a measured moved and it goes the same distance of the Flag Pole.
Happy trading.
As always, comments, likes are welcome. thx.

🚩 Bull Flags VS Bear Flags🚩What is a Flag Pattern?
A flag pattern is a commonly observed technical analysis pattern used to identify potential continuation of current market trends.
It is characterized by a period of consolidation, where the market experiences a relatively small range of movement, following a significant price movement.
This pattern is formed as the market returns to a state of equilibrium, following a large move. The flag pattern is considered a continuation pattern,
as it often indicates that the market will continue to move in the same direction as the preceding trend, once the flag breaks out.
This breakout typically occurs when the price of the security breaches the upper or lower boundary of the flag, and it is usually accompanied by an increase in trading volume.
📈📉The difference between a Bull flag VS Bear flag
The difference between a bullish and a bearish flag is in the direction of the price movement. With the bullish flag, the idea is to participate in a strong uptrend. Meanwhile, with the bearish flag pattern, the idea is to trade short in the direction of the prevailing downtrend.
- Downtrend vs uptrend: Bull flag and bear flag are both continuation patterns that form when the price of a stock or asset pulls back from the predominant trend in a parallel channel.
- Bull flag: A bull flag is a sharp, strong volume rally of an asset or stock that portrays a positive development.
- Bear flag: A bear flag is a sharp volume decline on a negative development.
- Bull flag and bear flag share the same traits: Traits of Flag Patterns include support and resistant levels, flag, flag pole, breakout points and price projections.
📍Entry opportunities
The most important component of any flag pattern trade is the entry. It’s generally advisable to wait for a candle to close beyond the breakout point before creating any orders to avoid being burned by a false signal. In the example above, the entries are made on a High risk - High reward mindset with stop loss bellow the flag pattern. Most traders will enter a flag pattern trade on the day after the price has broken beyond the trend line. The length of the flag pole is typically used to calculate the profit target. Even when the formation of a flag pattern is obvious, there is no guarantee that the price will move in the expected direction. As with most technical analysis, you will get the best results from flag patterns by applying them to longer-term charts as you will have more time to consider your strategy and analyze the price action.
👤 @AlgoBuddy
📅 Daily Ideas about market update, psychology & indicators
❤️ If you appreciate our work , Please like, comment and follow ❤️

P&G Big potential move in sight.A beautiful and mature bull flag has formed on a key zone of support for the P&G stock. Typically, best practice is to wait for the breakout but I like this chart set up so much I am starting a position at the lows of the flag. I have a healthy stop just under the flag formation.
Set your alerts, this one is going to make some moves soon!

JICPT| EURUSD retest bull flag structure on the dailyHello everyone. It's been a while since I published last trade idea. I've been very busy helping clients to review their portfolios in December.
EURUSD got my attention as it tested the key structure of the bull flag pattern. I marked two support zones in yellow color with the lower one expected to be not so easy to break.
Looking at the daily chart, you can identify that the downtrend channel was firmly broken on Oct.25th, a few days after CPI release which is below expectation. That's a turning point where DXY started to pull back from multi-year high.
In addition, the pair refused to create new low and a nice pullback has been formed thereafter.
As mentioned above, two yellow zones are considered to be support zones with 1.0550-75 and 1.0200-1.0300. The latter is a wider zone and we can zoom in to identify bullish reverse pattern on 60 min.
What do you think? Give me a like you're with me.

PLAY | Excellent Long Term Play | LONGDave & Buster's Entertainment, Inc. owns and operates entertainment and dining venues for adults and families in North America. Its venues offer a menu of entrees and appetizers, as well as a selection of non-alcoholic and alcoholic beverages; and an assortment of entertainment attractions centered on playing games and watching live sports, and other televised events. The company operates its venues under the Dave & Buster's name. As of January 30, 2022, it owned and operated 144 stores located in 40 states, Puerto Rico, and one Canadian Province. The company was founded in 1982 and is headquartered in Coppell, Texas.

SAND LONGS SET UPBullish bias on SANDUSD
- adapting to bullish fundamentals in crypto market due to the recent cpi data release and fed pivot
- bull flag market structure form on the 4hr timeframe.
- Price showing rejections at key support on the very high timeframe
Trade safe and enter upon confirmations like a break and retest of market structure

20,21,22, $24 it's possibleWeak mexican economy with high interest rates the perfect mix for a disaster and the Mexican peso Knows it!, we should se over 20 in a few sessions. 3 bull flags!

DKS | Bull Flag Forming | LONGDICK'S Sporting Goods, Inc., together with its subsidiaries, operates as a sporting goods retailer primarily in the eastern United States. The company provides hardlines, including sporting goods equipment, fitness equipment, golf equipment, and hunting and fishing gear products; apparel; and footwear and accessories. It also owns and operates Sporting Goods, Golf Galaxy, Field & Stream, Public Lands, Going Going Gone!, and other specialty concept stores; and DICK'S House of Sports and Golf Galaxy Performance Center, as well as GameChanger, a youth sports mobile application for video streaming, scorekeeping, scheduling, and communications. The company sells its product through e-commerce websites and mobile applications. As of January 29, 2022, it operated 730 DICK'S Sporting Goods stores. The company was formerly known as Dick'S Clothing and Sporting Goods, Inc. and changed its name to DICK'S Sporting Goods, Inc. in April 1999. DICK'S Sporting Goods, Inc. was incorporated in 1948 and is headquartered in Coraopolis, Pennsylvania.

ABBV | Bull Flag Formation | LONGNYSE:ABBV
AbbVie Inc. discovers, develops, manufactures, and sells pharmaceuticals in the worldwide. The company offers HUMIRA, a therapy administered as an injection for autoimmune and intestinal Behcet's diseases; SKYRIZI to treat moderate to severe plaque psoriasis in adults; RINVOQ, a JAK inhibitor for the treatment of moderate to severe active rheumatoid arthritis in adult patients; IMBRUVICA to treat adult patients with chronic lymphocytic leukemia (CLL), small lymphocytic lymphoma (SLL), and VENCLEXTA, a BCL-2 inhibitor used to treat adults with CLL or SLL; and MAVYRET to treat patients with chronic HCV genotype 1-6 infection. It also provides CREON, a pancreatic enzyme therapy for exocrine pancreatic insufficiency; Synthroid used in the treatment of hypothyroidism; Linzess/Constella to treat irritable bowel syndrome with constipation and chronic idiopathic constipation; Lupron for the palliative treatment of advanced prostate cancer, endometriosis and central precocious puberty, and patients with anemia caused by uterine fibroids; and Botox therapeutic. In addition, the company offers ORILISSA, a nonpeptide small molecule gonadotropin-releasing hormone antagonist for women with moderate to severe endometriosis pain; Duopa and Duodopa, a levodopa-carbidopa intestinal gel to treat Parkinson's disease; Lumigan/Ganfort, a bimatoprost ophthalmic solution for the reduction of elevated intraocular pressure (IOP) in patients with open angle glaucoma (OAG) or ocular hypertension; Ubrelvy to treat migraine with or without aura in adults; Alphagan/ Combigan, an alpha-adrenergic receptor agonist for the reduction of IOP in patients with OAG; and Restasis, a calcineurin inhibitor immunosuppressant to increase tear production, as well as other eye care products. AbbVie Inc. has a research collaboration with Dragonfly Therapeutics, Inc. The company was incorporated in 2012 and is headquartered in North Chicago, Illinois.

Bullish technical conditions S&P 500 Index
Technical conditions: The +5.7% price jump on November 10th could be viewed by technical analysis as a “Flag pole” since the recent seven day price consolidation (daily chart) suggests a “textbook” bull flag continuation pattern is forming. The bullish theme seems to be holding with higher tops and lower bottoms on price since finding support at the October 13th lows near 3,489. Current price 4,005 with resistance (1) spotted near the November 15th highs around 4,050 and resistance (2) near 4,100 (round number). Therefore, from a technical view, long positions could be supported for the short term (5-25 days) provided price can remain above the 3,865 support for upside potential at 4,050 and 4,100 in extension.

Classic Bull Flag - Now I go long again!Traders,
Though the overall market sentiment obviously still remains extremely bearish, I am now most invested in longs than I ever have been since I started my $10,000 portfolio project. Yesterday, I bought Ethusd at the bottom of its daily wick and today I have picked up some BTCUSD.
Thus far, playing against sentiment has worked out handsomely. You'll remember (or maybe you won't unless you follow me elsewhere) I went long at the bottom of the wick on the 13th. Many were crying that this was it. This is the time we got to 14k or lower. I bought. I won.
Then again, just before the weekend, I went short. Now, my timing was off on that play. I thought we'd be more bearish during the weekend. We weren't. So, I held longer. Tightened my stops. And was stopped out earlier than my take profit. Which turns out to be okay cuz my TP was actually the 50 day ma and we wouldn't have formed this nice little bull flag here (red arrow) had my TP actually been reached.
And now, because support is being held on this nice little bull flag even in the midst of the bears coming back out yesterday again, I am going long.
TP yet to be determined but I am thinking somewhere around that 200 day.
Best to you and your trades,
Stew

High probability of seeing higher pricesI've entered long lately. Reasons:
Technically the trendchannel/flag has been broken to the upside. Trendcontinuation is very likely.
According to seasonality (10 years or longer) the price will peak in mid Octoboer/November (depends on the time period).
As problems in the supply chain, inflation etc. doesn't get solved quickly it increases only the price increase.

CHZ/BTC TRADE SETUP! A NEW ATH INCOMING!!Hello everyone, if you like the idea, do not forget to support with a like and follow.
Welcome to this CHZ/BTC trade setup.
CHZ looks very bullish in the daily time frame. It is breaking out from the bull flag like structure in the daily time frame. Expecting a 150% pump from here. Buy some here and add more in the dip.
Entry range:- 1000-1100 sats
Target:- 100-150%
SL:- 900 sats
CHZ is a Fan token and world cup is coming in the month on Nov. so we might see some good rally in many fan tokens. Buying a decent bag of CHZ here and will add more in the dip.
If you like this idea then do support it with like and follow.
Also, share your views in the comment section.
Thank You!

Bearish Bull FlagsBull flags are found in charts with strong uptrends and are considered continuation patterns. They form when price barely subsides as the oscillators revert downward, such that when the oscillators are ready to move up again, rapid increases in price recur. Below are some bull flags with bearish implications that suggest perhaps more economic pain is to come in the years ahead.
1. Eurodollar Futures (pictured in the chart above and below)
Eurodollars are dollar-denominated accounts at foreign banks or overseas branches of American banks. Eurodollar futures lead the Fed Funds Rate. Overnight, the Eurodollar Futures broke out of a months-long consolidation pattern. This has occurred because we are in quadruple witching season. Unfortunately, the scope of this gap up is a bearish sign for risk assets and the economy more generally. If my calculation is correct, this chart suggests that the Federal Reserve must now raise rates to at least 5.5%.
2. Japanese Yen to Gold Ratio
This chart shows a 20-year bull flag that formed between the Japanese Yen and gold. Decades of monetary easing have caused a profound weakening of the Japanese Yen. If this logarithmic bull flag plays out fully, it may cost millions of Yen for a single ounce of gold in the years to come. A major problem will occur if its populace begins to believe that it is no longer worth converting their labor into Yen.
3. Overnight Reverse Repurchase Agreements
This chart shows what appears to be a bull pennant forming in the amount of securities that the Federal Reserve has sold via overnight reverse repurchase agreements (also known as the "repo facility", technically reverse repo in this context). To put simply, the Federal Reserve has been proliferating its use of the repo facility to try to contain inflation. This chart, which once provided little technical analysis value in the past, now seems to show a bull pennant forming. If a breakout occurs then this could suggest that inflation is continuing to spiral out of control, as they Fed is forced to vacuum more and more dollars out of the system.
4. S&P 500 vs. Nasdaq
This chart shows that, after decades of the Nasdaq 100 stocks (QQQ) outperforming the broader market (S&P 500 ETF - SPY), a bull flag is now forming in the chart of their relative performance. If this bull flag pans out and SPY breaks out relative to QQQ, this would be quite bearish, especially since SPY itself is beginning to oscillate down on the higher timeframes. This could mean that as monetary tightening deflates the everything bubble , tech will remain at the forefront of the declines.
5. Commodity Prices
This chart plots the Commodity Index Tracking Fund (DBC) relative to the U.S. money supply (M2SL). If commodity inflation was solely due to excessive money printing then commodity prices would generally move in a flat horizontal line relative to the money supply. However, commodity prices are moving up much higher than the money supply, which suggests that other commodity supply issues are more to blame than simply increased money supply. One can only speculate what these extraneous factors may be: War, pandemic shutdowns, deglobalization, climate change, aging and less productive population, etc. What we know for sure is that the Fed is trying to fight this inflation battle solely through monetary tightening. But can the Fed solve these larger-scale inflationary issues through monetary policy? If so, it's hard to envision its success without a major economic downturn.
6. Dollar Index
Perhaps the most alarming bull flag with bearish implications is that of the dollar index. The dollar index (DXY) measures the strength of the U.S. dollar relative to certain other currencies. It appears to be forming a bull flag on its yearly chart. Bull flags that form at this high of a timeframe often signal a new supercycle or prolonged period in which the context has changed and will remain changed for years or decades to come. In this case, the context of lower and lower interest rates over the past several decades has ended. As the U.S. economy remains strong relative to much of the rest of the world, and as monetary tightening occurs in the US while less tightening or even loosening occurs in much of the rest of the world, the value of the dollar will continue to climb higher.
The implications of this are profound since a highly indebted global economy may not be able to afford to service its dollar-denominated debt if the dollar rapidly strengthens. If this bull flag pans out, it may inevitably lead to a financial crisis.
To learn more, you can watch this video about the Dollar Milkshake Theory : www.youtube.com
If you've identified any bull flags with bearish implications please share your chart below! Feel free to leave your thoughts in the comments below, as well. If I've made an error in my analysis leave a note below.

RVN/USDT TRADE SETUP! READY FOR A 80% MOVE TO THE UPSIDE!!Hello everyone, if you like the idea, do not forget to support with a like and follow.
Welcome to this RVN/USDT trade setup.
RVN looks good here. Breaks out from the bull flag-like structure in a 4hr time frame. Expecting a 70-80% bullish rally from here. Buy some now and add more in the dip.
Entry range:- $0.038-$0.034
Target:- 70-80%
SL:- $0.036
Use low leverage (2x-4x)
If you like this idea then do support it with like and follow.
Also, share your views in the comment section.
Thank You!

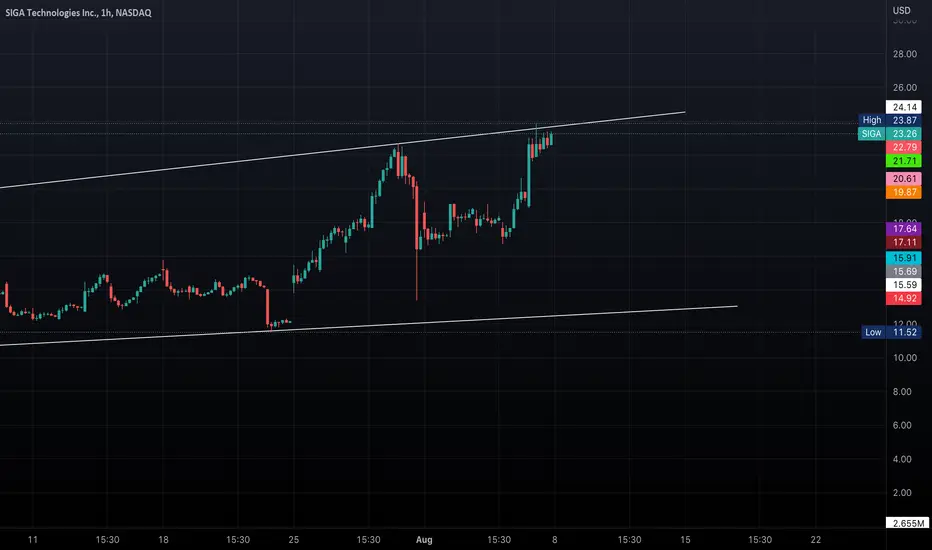
SIGA to Break Upper Trendline?SIGA has an ascending channel pattern on the daily chart.
A closer look at SIGA shows a bull flag formation on the hourly chart.
I strongly believe that a break of the flag (on the hourly) will push SIGA above the upper trendline of the ascending channel (on the daily).
The measured potential maximum move of the bull flag is approximately 4.18 points and the measured potential maximum move of the ascending channel is approximately 15.90 points. Therefore, the combined potential maximum move approximation is 20.08 points.
Therefore, my entry will occur after price breaks and holds level 24.
*This is not financial advice.
Loved and Blessed,
MrALTrades00
Bull Flag trading Long GoldAll information is on the Chart.
Gold chart is found on a descending channel and a Bull Flag has formed. Bull Flags are measured moves.
Entry: 1717
Stop: 1700 (Below the Flag)
Take Profit: 1800
Successful Investing is the ability to manage risk and foresee possible opportunities in the near or further future, prepare ourselves and take the risk when the opportunity presents itself.
Invest safe and Happy trading.
As always, appreciate the like, comments and share.

Bull Flag trading Long on EurUsdAll in information is on the chart. Chart is on a descending channel and a bull flag has formed.
Bull Flags are measured move.
Entry: 1.0159
Stop: 1.0065 (Below the Flag)
Take Profit: 1.037
Successful Investing is the ability to manage risk and foresee possible opportunities in the near or further future, prepare ourselves and take the risk when the opportunity presents itself.
Invest safe and Happy trading.
As always, appreciate the like, comments and share.
