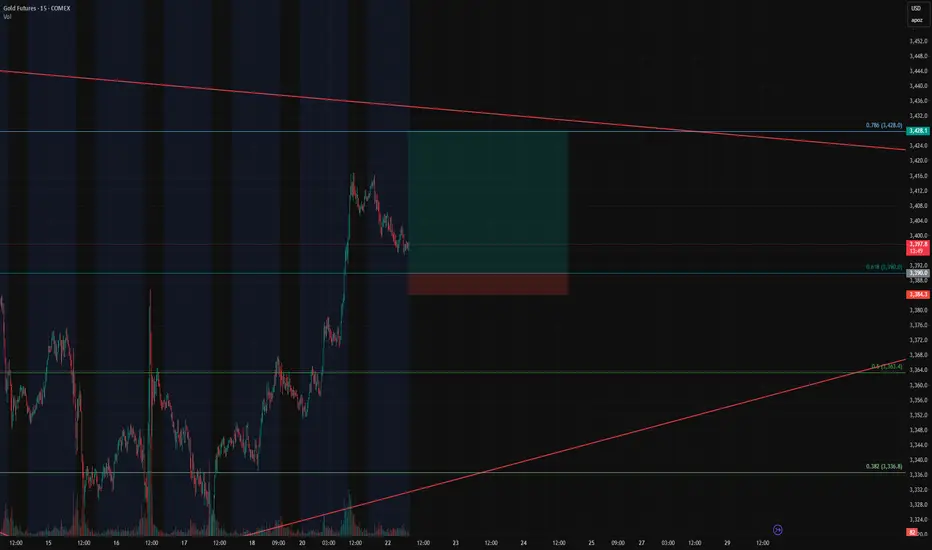
Gold Futures Long Setup – Breakout Continuation off the 0.618 FiGold Futures Long Setup – Breakout Continuation off the 0.618 Fib
Instrument: Gold Futures – COMEX ( COMEX:GC1! )
Timeframe: 15-Minute
Trade Type: Long – Breakout Continuation
Entry Zone: 3390 (0.618 Fibonacci retracement)
Take Profit: 3428 (0.786 Fib)
Stop Loss: 3384
Risk/Reward Ratio: 6.68
Setup: Bullish Flag on Retest
🔍 Trade Thesis
This trade is part of an ongoing breakout continuation strategy we've been trading, and now we're eyeing a pullback entry as price returns to a key retracement level.
Price nearly exploded through the 0.618 Fibonacci level (3390) during the prior breakout.
Now it's pulling back in a textbook bullish flag formation, suggesting healthy consolidation before the next leg.
The 0.618 retracement is aligning with previous intraday structure and trendline support — making this an ideal level to scale in.
This is a high R:R continuation play, with targets set at the 0.786 Fib level (3428) — right before macro resistance kicks in.
🎯 Entry & Exit Strategy
Entry: As price touches 3390 or forms bullish confirmation at the level.
Stop Loss: 3384 – tight and below key fib/flag structure.
Target: 3428 – based on 0.786 Fib extension and breakout continuation projection.
📊 Why This Works
Breakout behavior: Price respected the breakout impulse and retraced cleanly into a bull flag.
Fib confluence: 0.618 pullbacks are a classic entry in trending markets.
R/R of 6.68: Excellent reward profile vs. limited risk.
Bullflags
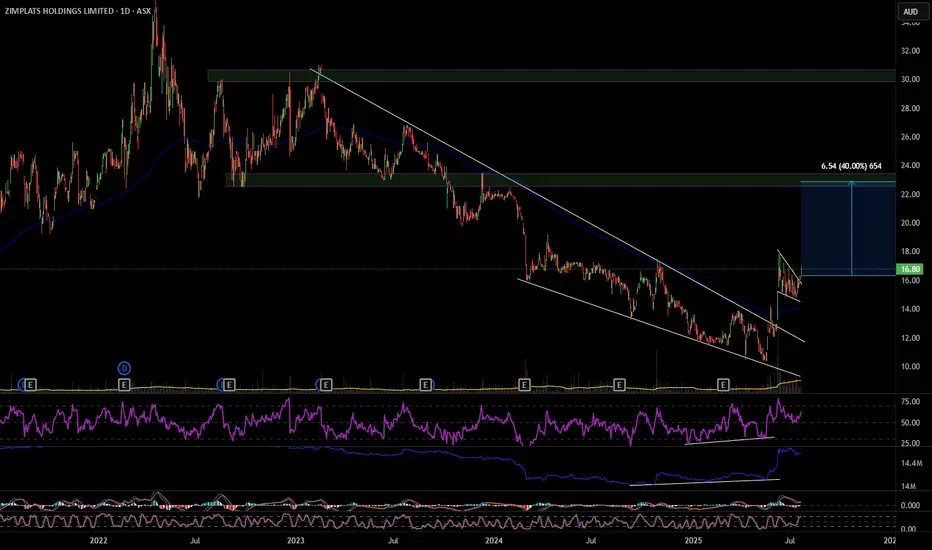
ZIM 40% move up
ZIM has broken out of a descending wedge with bullish RSI and OBV divergence, also multiple divergences on smaller time frames. On the hourly it's had a pull back and formed a bull flag that it has also broken out of. ZIM looks to have formed a change of structure forming higher highs and higher lows, my first target will be $22.90 a move of 40%. Definitely one to consider. Good luck and happy trading 🍀
Double Bull Flags on an Ascending Triangle breakout on the dailyDaily, double Bull Flag, on top of an Ascending Triangle Breakout. Golden Pocket on the Fib Ext is $588 🥂

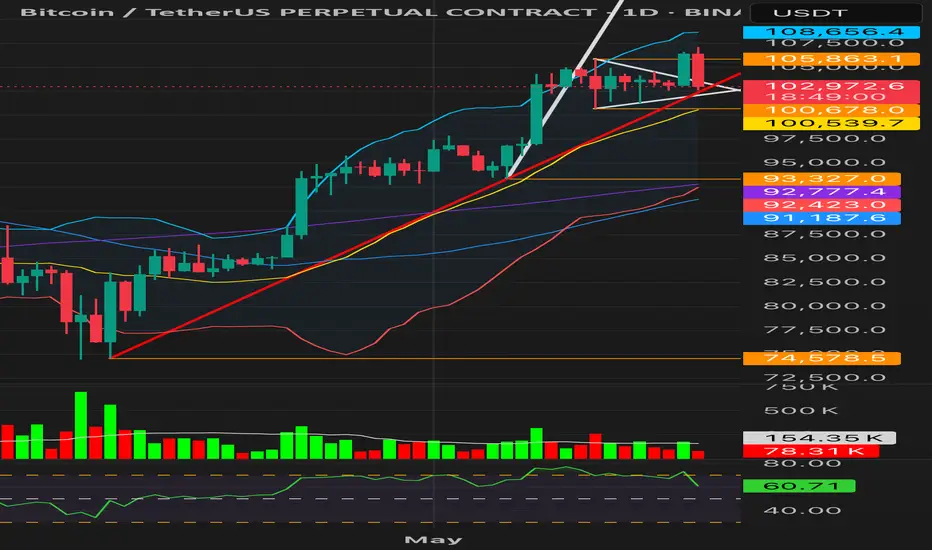
Bitcoin: Promising Patterns and Potential BreakoutBitcoin's recent price action has been nothing short of captivating for traders and analysts alike. On the daily chart, we've observed the formation of an Inverse Head & Shoulders and a Cup & Handle pattern, both of which have now transitioned into a Bull Flag. These bullish signals suggest a strong potential for upward movement.
Zooming into the 4-hour and 1-hour charts, we can see prominent Ascending Triangles taking shape. These patterns are often harbingers of significant breakouts, and it appears that Bitcoin is winding up for a substantial move.
Moreover, when utilizing a Trend-based Fibonacci Extension on the daily timeframe, the golden pocket points to a target of $126k, with the next pocket at $185k. This aligns with historical data and technical indicators, suggesting that Bitcoin might be poised to rewrite history once again.
Stay tuned as we monitor these developments and anticipate what could be a historic breakout for Bitcoin!

Nasdaq: Bull flag breakout on daily chart, testing ATHsBeen a while since I last posted. So figured I'd share this quick chart. Market undoubtedly have been incredibly volatile this month. However luckily, the Nasdaq has been forming bull flag on the daily chart. This follows a strong prior uptrend. The breakout took place today, sending the index to test ATHs.
Notable stocks making a move are names like NASDAQ:AMZN and NASDAQ:NVDA , mainly due to the broader market strength. Other indices, such as the S&P 500 ( SP:SPX ) also are breaking out as they form a similar bull flag pattern.
At ATHs, this is a deciding factor of where the market goes next. Either it bounces off to near-term support, or the market rallies to a new all-time high until next cooldown.
Note: not financial advice

XAUUSD Is XAUUSD getting ready for new ATHs? Gold has formed a clear bullish flag pattern and retested it clearly. One Thing I am looking for the retest of 50 DEMA . If the Price holds above the 50 DEMA, there are much chances that gold may target the new ATHs very soon.
What you guys think about it?

Monster Breakout brewing for ASTS🔍 NASDAQ:ASTS Weekly Chart Analysis (Accurate)
Pattern: Massive bull flag / consolidation wedge after a parabolic run.
Current Price: ~$31.20, sitting near the midpoint of the descending channel.
Structure:
Price is compressing between lower highs and higher lows.
Volume spikes on up moves, low volume on pullbacks = bullish accumulation.
Testing upper trendline of the flag — breakout could trigger a new wave.
✅ Favorable Path:
Break and weekly close above ~$34.00 (channel resistance) confirms breakout. That opens up a measured move targeting $50–55 short-term, and possibly $70+ if momentum accelerates.
🎯 Measured Move Target:
Pole base ~$6 → Flag peak ~$36 = ~$30 range
Breakout above $34 → Target = $34 + 30 = $64
⚠️ Invalidation:
A breakdown below $24–25 zone would invalidate the flag and suggest distribution instead of continuation.
🔑 Summary:
Setup: Weekly bull flag after a parabolic leg
Bias: Strongly bullish with breakout potential
Trigger: Weekly close above $34.00
Short-term target: $50–55
Full measured move target: ~$64
Invalidation zone: Below $24
Smart money appears to be loading the dips. Breakout traders should watch $34 like a hawk.

NVDA: Ascending triangle break, bull flag on S/R retestHey traders! I'm back and once again, I've spent almost the whole evening (lol) trying to figure out the odd, strange price action we've seen from NASDAQ:NVDA over the past few weeks, and especially today!
As we all know (I assume), Nvidia failed to disappoint on earnings once again, and we saw a HUGE gap up overnight, as far as up to the $143 mark. However, we soon began to see a dip. That's fair, as traders will likely sell and take profit.
However, the dip became a larger dip, and Nvidia finished the day basically at 3.2%. But it seems that the pullback may been pretty healthy.
Because as you can see from the chart, Nvidia has been forming an ascending triangle ever since the 14th May. That was after the sweet run it had prior to that. It has tested the £136-137 area as a major resistance line ever since until finally, a strong earnings report sent Nvidia above the line.
After the gap up, throughout the day, the stock went into a controlled, composed downward channel which what we like to call, a bull flag. This is taking into consideration market hours, not extended hours. This bull flag is bullish in its own way, but it is also a sign of a retest of the $136-137 resistance zone. This is officially a support zone now.
A successful retest from this support zone will cause a bounce, especially from the support trendline, and likely send the stock towards $140+, possibly extending its reach to $150 if broader market strength (Nasdaq) continues.
On the contrary, a dip below the support line and a crash below the red support trendline, would likely send the stock lower to $133 as next support.
As long as Nvidia maintains $136-137, the bulls are in control.
Note: Not financial advice. Please do your DD.

TSLA: Break-out above bull flag, possible cup and handle?So, a few days ago, I posted about a bull flag forming on the daily chart for Tesla. This flag pattern was a period of consolidation following an incredibly whooping rally from the $270 mark to around $350 (around a 30% or so gain).
Today, we have a new break-out from this consolidation period, and as of writing right now, Tesla is up 7%. It has now breached the $350 resistance level.
If you look more closely, the chart pattern resembles something close to a cup and handle pattern. You have the cup base going from the 20th of Feb 2025 all the way to the 14th of May 2025. Our bull flag which lasted between the 14th of May until the 23rd of May (last Friday), could as well be a handle for the cup base.
A break-out from not only the bull flag but the cup and handle could signal a massive move towards $400, however $375 and $390 could be points of resistance, and it would be wise to watch for a cooldown in the short-term.
Upcoming this week, it might worth mentioning that NASDAQ:NVDA earnings could have a strong impact on tech and affect Tesla - even if Tesla isn't much exposed to AI as the semiconductors.
To conclude, target is $390-$400 however as we all know, nothing is guaranteed :)
Note: Not financial advice. My analysis is not advice, rather just an idea. Please do your DD as well.

MDLZ - Bullish Flag patternBullish Flag pattern
The Bull Flag pattern forecasts in the near future. Currently, it's just early planning with small profits and a reminder to set a stop loss if the pattern cannot breakout upwards.
Both the M50 and MACD indicators suggest the potential for price increase.
The volume is still low so it cannot break out yet.
The price now (Closed on 05.23.2025): $66.14
Price target: $70.11/ $74.64/ $84.60.
Stop loss: $63.43
IMO, amateur trader.

S&P 500: Consolidating & forming bull flag on support trendlineSo, we all know that the market is taking a breather, and the past week has been mostly flat (kind of). There have been plenty of headlines, some good, some bad. Most notably, the news about the Moody's US credit downgrade. I woke up one morning, took a look at LinkedIn and saw all the CFA-certified investing experts expecting a massive game-changing moment, potentially a market crash.
Except, the market hasn't responded so negatively. In fact, I'd say that while long-term yields have been rising, the market has been doing its own thing .
For instance, taking a look at the daily chart of the S&P 500 paints a different picture of the doom and gloom that I've been hearing ALL weekend and ALL week long. As you can see, the index is currently sitting on the daily support trendline which goes back to the 7th April low.
On that trendline, taking a closer look, it seems the flat price action has been forming a bull flag. It's quite narrow and tight. But it certainly is a fine-looking bull flag. And a break above that would take the S&P 500 even higher.
This would also likely have a positive effect on other indices. Furthermore, it might be worth keeping an eye on the big S&P 500 stocks that are high-beta and like to follow the market.
So, to my point about how the market has been doing its own thing...seems that the Moody's downgrade could have possibly been already priced-in. I could be wrong, of course, as markets are still quite volatile and fragile to any sort of macro and global developments about trade and conflicts around the world.
Thank you for reading.
Note: not financial advice

MAGIC/USDT – From Consolidation to Explosion?🚀 MAGIC Bull Flag Formation – 200% Potential Incoming?! 👀🔥
Hey Traders! If you're all about high-conviction plays and real alpha, smash that 👍 and tap Follow for more setups that actually deliver! 💹💯
MAGIC is showing strong signs of a breakout from the descending channel on the 4H timeframe. After consolidating inside the channel for weeks, it has now approached the upper boundary and is testing it with bullish momentum supported by the EMA.
🟢 Long Position Activated
🔹 Breakout Confirmation waaiting
🔹 Volume Picking Up 📊
🔹 EMA Flip Incoming 🔄
🎯 Targets:
TP1: $0.25
TP2: $0.31
TP3: $0.39
TP4: $0.46+
🛑 Stop-loss: $0.151
📌 Leverage: 5x max
💡 A clean breakout from here can lead to a massive move—just like last time with a 273% pump! Don’t sleep on this one.

BTC Bull Flag Failure or UTAD? Apex Retest UnderwayBitcoin’s breakout from the bull flag was swiftly rejected after a wick above 105.8K, suggesting absorption and supply at the highs. Price has now fallen back into the flag apex — a red flag for continuation bulls.
Key Observations:
• Breakout was absorbed and rejected with no follow-through.
• Current price action is compressing inside the apex again.
• RSI dropped to 60.22 with weakening volume momentum.
• Support from mid-Bollinger Band (100.7K) and 55 SMA (100.5K) is now critical.
If price closes below this 100.5K–100.7K cluster with rising volume, the bull flag will be invalidated. This could evolve into a UTAD (Upthrust After Distribution) if the rejection confirms as a trap above resistance.
Watching for:
• Breakdown from structure (close below 100.5K)
• Rising sell volume
• RSI trending below 50
A close below these levels may mark the transition from re-accumulation to distribution.
⸻
BTC/USDT 4H – Bull Flag Breakout SetupA symmetrical triangle has resolved to the upside, confirming a bull flag breakout in line with the prior uptrend. Current momentum is supported by:
* RSI breakout above 60
* Price above mid-Bollinger Band and 55 SMA
* Breakout candle closing above triangle resistance (Yet to confirm)
**Targets:**
TP1: 108,000 – nearest horizontal resistance
TP2: 112,700 – flagpole projection from 104.5K breakout
TP3: Trailing target with 1.0% callback from breakout zone
**Stop Loss:**
Below triangle apex (\~103,000) or 55 SMA (\~103,480), depending on which is closer
**Volume:**
Still below average but RSI confirms bullish momentum. Watching for volume follow-through to confirm strength.
**Wyckoff context:**
Potential Phase D in a re-accumulation range, with breakout as Sign of Strength (SOS) after a spring-like consolidation.
This breakout is being monitored as part of a continuation setup toward 112.7K with proper risk management in place.

$SPY / $QQQ – Bull Flag Breakout in Progress?📈 Both AMEX:SPY and NASDAQ:QQQ just broke out of bull flag patterns after a strong recovery from the April lows.
🔍 Technical setup:
Flags formed after a vertical rally ✅
Breakout candles with follow-through ✅
Still riding key EMAs (20/50) with decent volume ✅
📌 Targets based on flagpole projection:
AMEX:SPY → ~582–590
NASDAQ:QQQ → ~505–510
However… mind the context:
We’re heading into macro risk events, and positioning is getting crowded.
These breakouts need confirmation via volume + higher high closes.

MSFT - Potential bull flag/pennantSimple technical analysis showing what seems to be a bull flag on MSFT on the weekly chart. No rocket science - those who know what a bull flag is, will know exactly what this means.
Disclaimer: Not financial advice

GBPJPY 4h Long Setup Clear bullish structure with clean higher highs and higher lows intact
Price formed a bull flag after a strong impulse leg showing continuation potential
Breakout of the flag confirms momentum with aggressive bullish candle and volume
Entry : 192.459
SL : 188.167
TP : Trail 195.898
RR 1 : 3.1
Market is flowing with bullish pressure and breakout indicates wave extension
No counter structure in sight, trend continuation expected
Let the market breathe and move

SMCI - Bullish Wedge Flag patternBullish Wedge Flag pattern
The price broke out on last week and has retested today.
In the chart of the week frame, the price is on the MA200 line.
The price now (Closed on 04.30.2025): $31.86.
Price target: $48.18/ $63.05
IMO, amateur trader.

ADBE to $465 - Chance for a BounceNASDAQ:ADBE ADBE, as well as other tech stocks, was beaten hard over the last couple of months. The earnings recently did not provide any relief for the chart either, although the figures were not particularly bad. In particular, the possible prospect of finally being able to expand and monetize Adobe's own AI “Firefly” continues to offer good opportunities.
With a PE of now under 20, Adobe has become quite favorable as a company that continues to grow well in the SaaS sector. It has also reached several technical support zones. We are at the lower edge of a very large bull flag that has been in place since the beginning of 2024. Horizontal support at $385 is also supportive. We have 3 large daily gaps in the chart above us and a bullish wedge within the flag. This is a good place to start buying for a possible bounce towards $465.
However, one must bear in mind that the overall market remains bearish. Purchases should therefore be closely hedged and not be too large. However, it would be wrong not to use this opportunity to enter the market.
Target Zones
$465.00
Support Zones
$385.00
$360.00

Tellor (TRB) a hidden gem, will previous price action repeat?Hello again dear reader for a another analysis.
From August to December 2023 TRB has seen a MASSIVE move of 7000% gains over the course of just 126 days. Since then it has corrected a whopping 96%!
There is now a reason to be bullish on this coin. Looking at the drawn structure we can see multiple important touch zones described with the letters ''A till F'' (NOT ELLIOT). It is quite possible price action might correct further till 19$ where a big support zone lies, but there is no guarantee that ''will'' happen.
Target: 1200$ (M-cap of 3B which is very achievable)
Stoploss: 15$
I aim to keep analysis simple and easy to understand. Any questions of requests for analysis feel free to ask!
Rustle

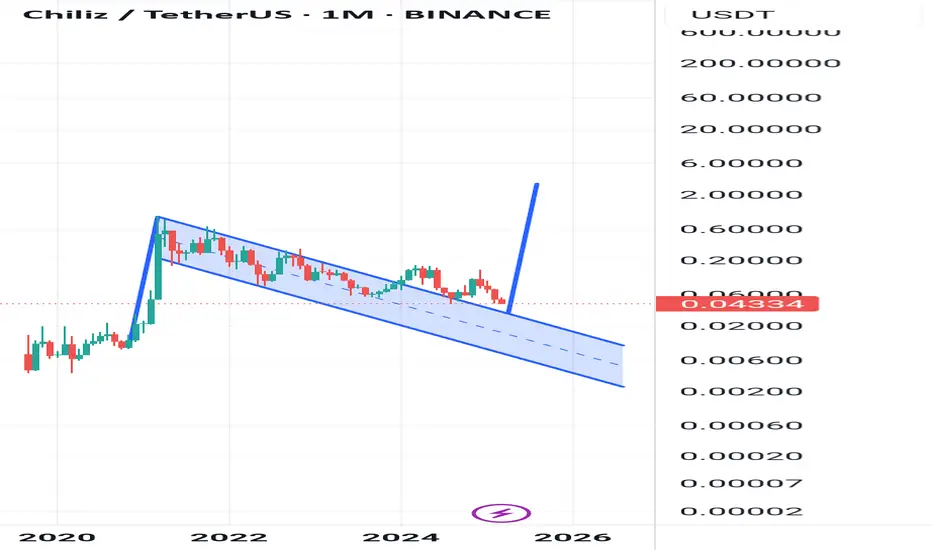
Have you considered this alternative?Chiliz (CHZ) leads innovation in fan engagement with their favorite teams through blockchain technology. Its platform enables the creation of Fan Tokens that offer users exclusive access to experiences and decisions related to sports clubs, eSports teams, and more.
Chz has been trading in a massive bullflag as seen in the above analysis. Although it hasn't seen alot of love recently i suspect it will do well in the coming months ahead.
Target: 3$
Stoploss: 0.032 (upon re-entry of the channel)
Rustle
New ATH should be coming in ETHBull FLAG, Respect of Bullish Trend.
Everything else in the chart. Nothing much to glorify.
Great setup, beware of your risk appetite and manage your risk and position well.
FYI, This is an educational post and nothing else.
Do Your Own Research. This is not an financial advice.
Good Luck.

