XLMJust put this out into my group. Full disclosure this is my 4th attempt to swing trade XLM. I hold of course because it is the best coin IMO but trying to swing has been tricky. Let's see.
Bullflags

SPCB waiting for enter opportunitySPCB looks promising, the average target is $1.80.
I suppose there will come a even better entry sooner or later, just wait.
The pattern looks like many bullflags, always with high volatility.
Entry points and targets are mentioned in the chart, could end up in a good swing. I would add slowly from the entry 1.

EURGBPAfter ranging in the pattern for a very long time the pair has finally broken out of it's long falling channel .With this we expect a re-test then the break of the mini resistance for the jolly ride

AMP Monthly Buy SignalAMP has generated a bullflag on the Monthly timeframe
Really good signal if you are looking to long this coin
and by long, I mean long.. (Month by Month)

FREN is Making a Bull Flag PatternIf upper flags gets broken and price are closed, possible entry is 123.
The possible target might be to 134.

Coffee Futures in a bullish consolidationAs you may see in this chart, the price for coffee consolidates and could form a bullish flag.
IF the price breaks the channel (flag) to the upside, which could happen with quotes in the range between 160-163 USD or above in the following days/weeks, it is more likely that we see a continuation of the bullish trend. The next short-term target zone is located at 175 USD. The long-term target is at 280 USD.
IF the price breaks the flag to the downside, the coffee price is likely to be supported at the fib levels 143.65, 138.15, and 131.40 USD.

BTC USDT What are the Shorts saying.BINANCE:BTCUSDT
This is the battle between the WALL STREET BETS vs the SHORT BIDS...
remember last time when Friday 9 of JULY was expecting as SHORT or dip and a way for us to reach the 31K again we did not make it.
It only lead for the short be huge loss. Bull wins.
It was too early or is it how it should be?
I am 50 - 50 on this one... let me know your sentiments.
the Flag says... BULLISH
but the BTC.D and BTC Short says SHORT to 30K... Are we? or should be short?
will streetbets make a 500% pump some of the coins in Binance? will they buy BTC?

A bull Flag turned into a symmetrical triangle formation?Bitcoin saw a sweet bull flag breakout get rejected on the daily horizon. The Bullish target would have pumped Bitcoin all the way to 58k-62k with a 56% increase (560% profit at 10x Leverage).
However, a rejection confirmation here can send us back down to hell (not as bad as it sounds though "local hell") but this isn't a bad thing!
For traders out there looking for profitable trades, this can give you a nice 20% profit from a short (even higher with a decent leveraged position) and a massive 81% pump to the upside right after that.
Be careful with your trade and have a nice week!

Early Bull Flag breakout - A comfortable ride to 58k$Hey there crypto community,
Bitcoin has been riding a wonderful Bullish wave since that huge dump back in March and it doesn't end here. Some traders were calling 42k a blowoff top but that is not true as you can see in this chart.
Bitcoin saw a nice break out of this Bull Flag consolidation and looks set to ride that trajectory to the 58k target. The best assets to hold at the moment are Bitcoin and ETH as the trend has been confirmed on both.
Note: We do not contact anyone for any service fee. Everything we post is to help starters learn and profit together with us.
To support our work:
Use the following referral links
Bybit: (Futures trading - Free bonuses available up to 600$) bybit referral code: lRzW1
Binance: (#1 crypto exchange - Bonuses > 5%) binance referra code: DRGSGI72
Thank you!

Possible bullflag on Corn cash. Se my related idea. We are in for a lot of volatility in the grain market.


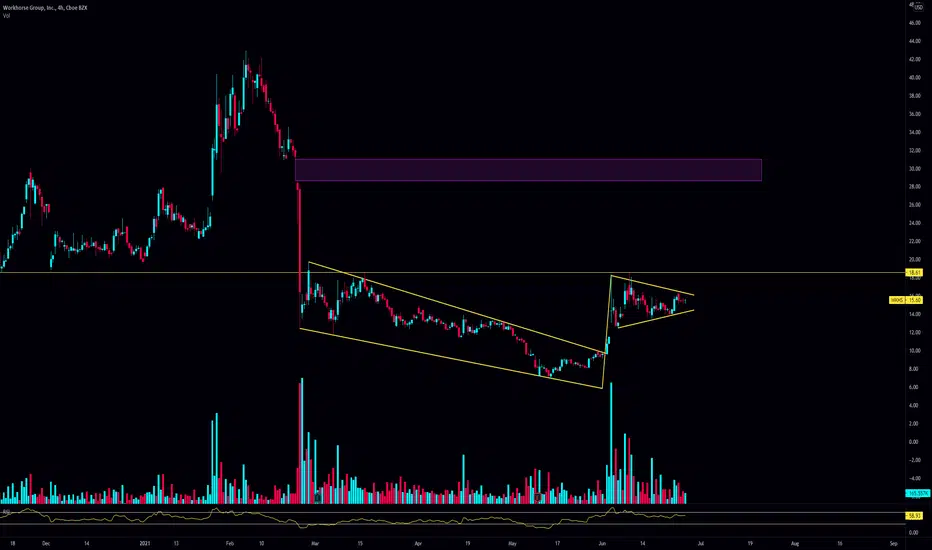
$WKHS - Bullish Setup with Huge Accumulation VolumeWKHS is one of the most shorted stocks on the market right now, having rough 40% of it's float sold short.
Currently the technical chart looks amazing, with a bull flag being setup on top of huge accumulation volume. The dip was clearly bought, and now we've got a textbook bull flag with a huge gap left around $30 mark. If we breakout there's an extremely good chance we start running. We may may encounter resistance or bounce around 18.60, but above that it's clear skies until we fill the gap.
If we're lucky we may get a front row seat to a potential squeeze as well, due to the high short interest on the stock (not that it isn't justified). We've seen countless meme stocks and stocks with high short interest start running these past few weeks so I wouldn't be surprised to see WKHS follow suit once people catch wind of it.
All in all, we've got a relatively safe trade here. I'll likely enter a monthly position come Monday with a stop set around the 13.60 level. Happy trading!
BLNK LongLong BLNK price targets 45-50. Breakout of downtrend followed by bull flag and breakout doji on friday. Look for immediate move Monday AM.

$AMD bullish again? Here's the analysis.Hello everyone,
AMD has been an outperformer since it tested the 73 support multiple time earlier this year. It broke out of a 6 months long downtrend line in 2020 November and is currently backtesting it (thick yellow line). This may indicate the strong hyper momentum semiconductor stock is ready for another powerful rally.
Disclaimer: I personally hold AMD shares so this analysis is biased toward the bull side.
Pros:
- Downtrend line broken and currently holding the ratest
- Lightning bolts price action, a classic bull flag that points toward 89-91 areas.
- Tech and growth being in favor again with the easing of inflation fear.
- Trading lower than my valuation of 96 - 110, note that this valuation is subjective and priced in with a high PE ratio.
Cons:
- R/R ratio for the trade right now is not favorable to the bull until it clears 89 - 94 resistance
- Slight bearish divergence on the RSI
- Change in monetary policy could have a negative impact on tech stocks again.
- Market breadth across shows bearish signs as not most stocks are above 50EMA
Summary: Technicals of AMD are favoring the bulls and stock outperformance has not changed for the short term.
For holders: Monitor price action around 89 - 94 resistance, you should up your expectation with recent technicals
For non-holders: Buy around 81 - 83 as the previous resistance areas are likely becoming support.


Simply put, THETA will out perform BTC next few monthsClear massive bull flag breakout has occurred on the 6-hourly chart (and others). The flag goes back to about 4 months ago now. Very strong sign for THETA/ BTC pair for the next few months.
Closing a 6-hour candle strongly above 27,700 sats with high demand will certainly launch a large upthrust.
Green squiggle would be a super healthy bullish return to test ATH. But how we come up to test ATH could vary wildly. Regardless, we are likely to at least touch ATH once more soonish.


Wish bullflagWish is forming an classical bullflag. I would expect an breakout after reeaching the APEX.
Check chart above.


BTCUSD 1h. Bull Flag Pattern. Target 46KHi everyone,
Thank you for considering reading my idea.
Since our previous idea was invalidated, this may be a bull flag that's about to break in a few hours to the upside. The target of this pattern is at 46K.
Like this idea and follow me for more analysis like this. TAYOR.
Cheers,
Juvs

Matic USD ParabolicClassic parabolic curve step formation. But flags have paid to date. In theory we double from base 3 flag.

ADA/BTC Forming another bullish flag. Moving towards ATH.Cardano is moving towards new ATH considering the ADA/BTC chart.
Currently we ca see the formation of a second bullflag since the head and shoulders breakout.
We expect some more consolidation before an upwards breakout.
Smart contracts are around the corner and money is coming towards ADA.
With its proof of stake mechanism it also is energy efficient.
Basic rules:
- Never buy the top/ATH
- Take profit as long as you can (also partial profit is profit)
- Use Stop/loss for leveraged positions
- If you are not experienced, don't leverage in the first place
Enjoy the ride and don't be too greedy.
If you like the content, please like, comment and give this channel a follow.
We would love it if you could share your thoughts in the comments.
Discussions are very welcome here.
Always do your own research and keep in mind that my charts and comments cannot be considered financial advice.
Cheers
ps.
Chart explanation:
Main lines:
- Green lines are tested support lines.
- Orange lines are resistance lines or, if we are above, possible support lines which were not tested yet.
- Cyan line is for volume trendline.
- White lines are Fibonacci retracement levels
Helplines:
- Purple lines are trendlines we take a look at.
- Blue, white and pink lines are 200MA, 50MA and 20MA.
- Yellow lines are for visual help only.
Boxes:
- Either entry zone or support zone. Check the description.
