Bullflag on 1D Chartlook at this beauty, next stop 69200 realm... fire it up.. who agrees?
with scarcity creeping in heavy, I don't see any reason for a heavy dump just about ready for a big jump... prove me wrong?
Bullflags

VDJP Daily - Another bullish set up in the makingThere is a large confirmed bullish inverse H&S (see prior charts) - and I was buying the dips around the 26.00 level into my ISAs and SIPPs. We have seen healthy consolidation over the past month and the etf now appears to be in the process of building a bull flag. This will be confirmed with a daily close above 26.70 and has a full target of 28.00. Given the already very bullish set-up, I will continue to keep adding to my position in anticipation of a further break higher. I will be rotating some of my funds out of UKX (which today successfully reached my full target) - as I believe VDJP offers better RR levels.

LTCUSD Bull flag To me it looks like a bull flag is starting to paint. Will enter a long position after confirmation. Cheers✌️💫🚀

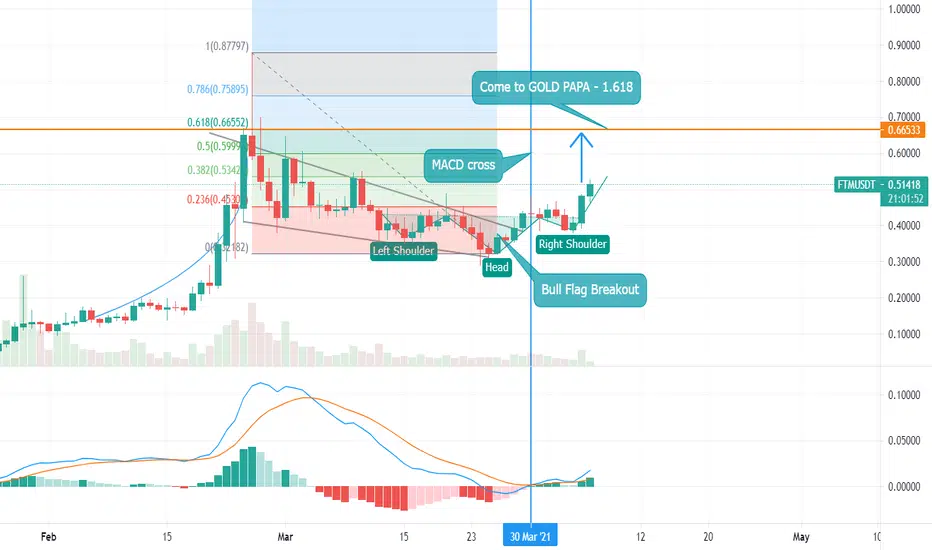
FANTOM, FTM to haunt the golden ratio in her scary upward trendMACD cross and a possible bull flag breakout. I think FANTOM has the ghostly legs to float up to the next GOLDEN ratio of opportunity..... And, if you're wondering, yes, I asked Doug and he agrees. Doug, you know, my iguana. Two taps of the back leg... go long, Three chin dips... go short. Once you understand the mysteries of reptilian trading, it's easy bro.
Bull flag It appear we are about to break out of this wedge and get out of this lower lows trend. If it breaks out of this bull flag we should see 80 in no time.

$MIR Looking to Break Out of Bull FlagI can't imagine there are many people talking about Mirror Protocol right now, but I personally think this is one of the best looking charts out there right now. Earlier this week, we had a breakout from the giant ascending triangle that has been forming since February 20th. We have since been consolidating in a bull flag and have even retested the top of the triangle. Also, the MACD on the 4h is starting to turn around to the bullish side. I took a position in this last night but am adding here in hopes of a breakout. I am targeting the $10 range but who knows where this can run since we are in price discovery.

MKR breakout after it's correction. Maker seems bullish with two targets short/mid-term. you can find targets with orange short-lines and stop is marked as well.

🔥 GRT Potential Bull-Flag BreakoutLike a lot of coins, GRT has been trading inside a descending channel for around 6 weeks now. The most recent bullish push from BTC launched GRT towards the top of the channel, breaking out slightly.
Before entering the trade, wait for confirmation that GRT has actually left the channel.
Happy trading!

🔥 FTM Bull-Flag BreakoutAfter seeing some incredible gains during February, FTM has seen a prolonged period of bearish movement in March.
Seeing most of the crypto market is recovering from a volatile March, FTM is following with a bull-flag breakout. Seeing the past bullish volatility, this breakout could very well target the current ATH around 0,88.
Happy trading!

BTC BULL FLAG TARGET PRICE $$61,500Easy pickings here folks. Watch the price action near the red horizontal lines as they are prior resistance lines.

🔥 MATIC Bull-Flag Break-OutAfter an amazing run-up, MATIC has come to a stop two weeks ago. For a long time we've seen MATIC trade in a bearish channel .
Recently, MATIC has made effort to break-out of the bearish channel , constructing a classic bull-flag pattern which might signal the next run-up.
Happy trading!

EURCHFLooking like a nice bull flag that has formed and broke for entry, we look like we are past the mental zone where SL hunts would be developing also

SUPER/USDT Update: Looking for new entries after target is metWe did hit our previous target so we now are looking for a new entry since Superfarm remains bullish for the next week.
Basic rules:
- Never buy the top/ATH
- Take profit as long as you can
- Use Stop/loss for leveraged positions
- If you are not experienced, don't leverage in the first place
Enjoy the ride and don't be too greedy.
If you like the content, please like, comment and give this channel a follow.
Always do your own research and keep in mind that my charts and comments cannot be considered financial advice.
Cheers
ps.
Chart explanation:
Main lines:
- Green lines are tested support lines.
- Orange lines are resistance lines or, if we are above, possible support lines which were not tested yet.
- Cyan line is for volume trendline.
Helplines:
- Purple lines are trendlines we take a look at.
- Yellow lines are for visual help only.
Boxes:
- Either entry zone or support zone. Check the description.

BNB/USDT Forming a bullflag and eyeing 500$Ethereum just announced another delay of layer 2 solutions.
This plays into the hands of the Binance chain and with BNB as their native token also is good news for BNB.
We are looking for a breakout of this bullflag.
Basic rules:
- Never buy the top/ATH
- Take profit as long as you can
- Use Stop/loss for leveraged positions
- If you are not experienced, don't leverage in the first place
Enjoy the ride and don't be too greedy.
If you like the content, please like, comment and give this channel a follow.
Always do your own research and keep in mind that my charts and comments cannot be considered financial advice.
Cheers
ps.
Chart explanation:
Main lines:
- Green lines are tested support lines.
- Orange lines are resistance lines or, if we are above, possible support lines which were not tested yet.
- Cyan line is for volume trendline.
Helplines:
- Purple lines are trendlines we take a look at.
- Yellow lines are for visual help only.
Boxes:
- Either entry zone or support zone. Check the description.

USDCHF a move to the 0.96 🦐USDCHF after our last analysis broke the bull flag and reach the 0.94 area as expected.
The market is now below a strong weekly trendline and a daily resistance.
According to Plancton's strategy if the price will break above we will set a nice long order.
--––
Follow the Shrimp 🦐
Keep in mind.
🟣 Purple structure -> Monthly structure.
🔴 Red structure -> Weekly structure.
🔵 Blue structure -> Daily structure.
🟡 Yellow structure -> 4h structure.
⚫️ Black structure -> <4h structure.
Here is the Plancton0618 technical analysis , please comment below if you have any question.
The ENTRY in the market will be taken only if the condition of the Plancton0618 strategy will trigger.

USDCHF bounce at the 0.382 🦐USDCHF after our last analysis bounced at the 0.382 Fibonacci level.
The market that is moving inside a bull flag is now looking up.
According to Plancton's strategy if the price will break above we can set a nice long order.
--––
Follow the Shrimp 🦐
Keep in mind.
🟣 Purple structure -> Monthly structure.
🔴 Red structure -> Weekly structure.
🔵 Blue structure -> Daily structure.
🟡 Yellow structure -> 4h structure.
⚫️ Black structure -> <4h structure.
Here is the Plancton0618 technical analysis , please comment below if you have any question.
The ENTRY in the market will be taken only if the condition of the Plancton0618 strategy will trigger.

🔥 ENJ Classic Bull Flag PatternAfter seeing amazing gains during the first half of March, ENJ has come to a halt recently. During this period of consolidation a bull-flag pattern has emerged. This morning, helped by Bitcoins resurgence, ENJ has broken out of the bull flag, potentially targeting a new ATH and beyond.
Happy trading!

SP500 > Simple but Powerful Setup for A Buy!!Thank you for taking the time to read my analysis, and if you feel generous and kind today, give it a like and leave a comment it will support the creation of new free ideas for you.
Follow up on #US500
Hello friends.
I said many times that the path of least resistance is to the upside, the FED made it clear, he wants Tech stocks to continue to lead this market.
here we have a bull flag that still has a chance to move to the upside and continue higher to 3950 before hitting 3969, it is only 1%.
of course, there is a chance the market completely ignores the above and breaks to the downside, but this trading, right?
Safe trading everyone
Check today analysis below⠀
>>in trading you are competing against other traders, so you better be prepared and ready
_____________________________________________________________________________⠀
-Disclaimer: This information is not a recommendation to BUY or SELL. It is to be used for educational purposes only⠀
-Please note this is just a PREDICTION and I have no reason to act on it and neither should you

Descending Triangle for BTC?!?!Since my previous chart on Bitcoin linked to this chart, we've seen BTC break-down from an Ascending Triangle after multiple fake-outs to the upside breaking the horizontal resistance; the green upward sloping support has been lost for the being, but is the recent price action merely another fake-out, but to the downside instead?
Well, only time will tell, as for now, I can notice a Descending Triangle forming, and on the RSI there is a similar pattern.
On the KST there has been a bearish cross where I've placed the red downward sloping finger.
It's possible this pattern plays out as a Bull Flag as well.
There's merit for an Inverted H&S pattern, the blue head icon would represent the head of the pattern, and the right shoulder would be the Descending Triangle pattern, but it would obviously have to play out bullishly to the upside as a bull flag for the inverted H&S to occur.

ASX:BMN BULLFLAGBannerman Resources Limited (ASX:BMN) is an ASX and NSX listed exploration and development company with a 95% interest in the Etango Uranium Project in Namibia; a southern African country which is a premier mining jurisdiction.
Bullish Outlook:
- Bullflag Identified
- Double Bottom off Daily Support
- RSI above 50.00 level
- MACD Bullish
- Volume increasing over the last 4 months
- Above 20 MA
- Targets above 1:2 RR
Bearish Outlook:
If previous high fails, then a test off daily support is likely. If bearish action continues then test of 8-9c is up next.
"DISCLAIMER: NO ADVICE. The information presented here is general in nature and is for education purposes only. Nothing should be considered to be advice. You should consult with an appropriate professional for specific advice tailored to your situation."

CTSI ready for pumpCTSI is trading smoothly inside the parallel channel. Also created a bull flag with 50MA support.

$GT long idea$GT at good entry here for day trade, 50 MA + golden pocket confluence - Looks bull flag. Adding here and adding more on the break. tight stop, below given level.

HD to $300HD, or Home Depot, broke out of a strong channel today. This is very bullish, and by taking the mouth of the channel (the first purple rectangle) and moving it up to the breakout point we get a breakout target of somewhere between $300-$306. I personally went long here and will take profits around $299.
