ADA, Resistance will Become Support I believe ADA is heading to $1.90-2
ETH is loosing dominance to ADA, BNB & DOT
DeFi gaining dominance FAST
Hard Fork was today
Bull Flag
Bullflags

XLM on the verge of some strong upward trajectoryHey y'all! Just trying to get some rep so I can chat. Check out this annotated chart for why I think XLM is poised to get some gains!
1) Decent indicators all around, although not ...Stellar (forgive me please).
2) The ascending channel has very obvious impulse/retest repetitions.
3) Bullish flag forming at the corrective phase of the most recent impulse.
Smash that like and thanks!

PLG - Bull Flag OpportunityAs a continuation from my first post, we have such a great opportunity for a 150% gain in AMEX:PLG from where we are right now. TVC:PLATINUM has broken out of it's long-term resistance (shown here: ) and we are seeing capitulation within the precious metals sector. I don't expect us to stay here long! Don't miss out!
The featured content is intended to be used for informational purposes only. Everything shared here is my own opinion. It is very important to do your own analysis before making any investment based on your own personal circumstances.

BNB next pumpI think that if BNB break the bull flag drawn here (blue line) it could reach the horizontal line that I've drawn here.
I'm going to wait for breakout and volume confirmation.
One thing that I really like is that the pole of the flag is exactly pointing to the previous ATH (yellow arrow)
For me it is a good indicator it could goes there if other requirements are met.

ADA to 1,40$ easyA bit late on this one but I see a bull flag on ADA that broke out and I used the height of the previous pole of the flag.
Really important to say that ADA is overall bullish and we are waiting for a great news in february from Charles.

Descending Triangle for BTC?!?!Or, potentially this pattern plays out bullishly, there's been a bullish cross on the KST, and whales like to negate patterns frequently with fake-outs in either direction before defining a shift in momentum.
The RSI is forming what could be considered a bullish pennant pattern, recently there's been a series of higher lows, but on the contrary, there have been a series of lower highs for nearly a week coinciding with Bitcoin's ATH's in price.
On the KST there's been a bullish cross where I have placed the blue downward-sloping finger.

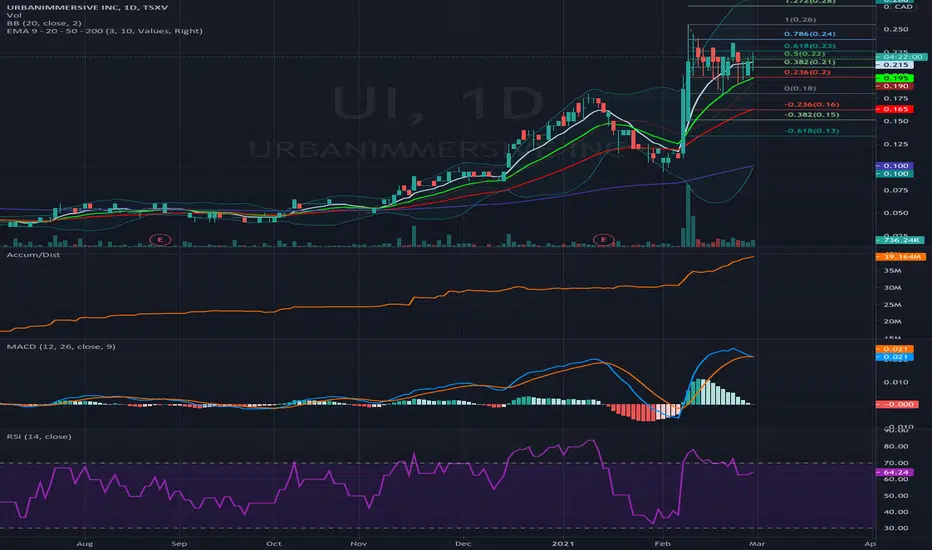
UI.V -- Bull Flag; strong fundamentals; good newsflow.UI has is a profitable company with strong fundamentals, making Bull Flag breakout likely, even during turbulent market conditions. Growing rapidly and expanding into international markets. Breakout could easily send it into .30 - .40 territory.
UPDATE! AUDCAD on a bullflag 🦐After our last analysis AUDCAD broke above the weekly resistance and currently the price is retracing inside a bull flag.
According to Plancton's strategy, if the conditions will be satisfied we can set a nice long order.
––––
Follow the Shrimp 🦐
Keep in mind.
🟣 Purple structure -> Monthly structure.
🔴 Red structure -> Weekly structure.
🔵 Blue structure -> Daily structure.
🟡 Yellow structure -> 4h structure.
⚫️ Black structure -> <4h structure.
Here is the Plancton0618 technical analysis , please comment below if you have any question.
The ENTRY in the market will be taken only if the condition of the Plancton0618 strategy will trigger.

AUDCAD-LongI got triggered on this one we have a nice bull flag and we breaking out of it impulsively lets see how it goes
comment your thought or idea down below

Potentially a descending triangle or bullish flag for Gold.Noticeably in blue, there's a descending triangle or bullish flag forming, and similarly, on the RSI there is an identical pattern.
The DMI is displaying a bullish cross where I have placed the blue downward pointing finger.

DOW an unstoppable bull? 🦐DOW after the yesterday's minor retracement into a bullish flag tested the support area at 31280 level before starting a new run.
According to Plancton's strategy if the price will break above we can set a nice long order.
–––––
Follow the Shrimp 🦐
Keep in mind.
• 🟣 Purple structure -> Monthly structure.
• 🔴 Red structure -> Weekly structure.
• 🔵 Blue structure -> Daily structure.
• 🟡 Yellow structure -> 4h structure.
• ⚫️ Black structure -> >4h structure.
Here is the Plancton0618 technical analysis , please comment below if you have any question.
The ENTRY in the market will be taken only if the condition of the Plancton0618 strategy will trigger.

MHH - Possible Bullish ScenarioFrom a fundamental viewpoint, Mastech Digital, Inc ( AMEX:MHH ) appears to be in great shape. In addition, when looking at a long term monthly chart, we have what appears to be a possible bullish flag scenario playing out. When we zoom in and look at the shorter term daily chart (shown), we see a clear downward trendline, acting as resistance, currently coming in at approx. ~$17.45 and falling. We also have big support coming in at an approximate range of ~$15.45 - 15.75. Should we see a break above the falling resistance line along with a daily close, I expect the bullish scenario to play out (shown in green). If it does, we will have buying entry points at both the breakout point and if we get the likely retest of the former resistance line (becoming support).
Should we break below support along with a daily close, I expect the bearish scenario to play out, where we continue grinding down within the downward channel. I expect this scenario to be less likely based on the long term pattern and fundamentals of the company, however we can't be certain either way.
Everything shared here is only my opinion and no results are guaranteed. Let's see how this one plays out. Good luck!

PLG: Bull-Flag Potential TargetAMEX:PLG has a potential bull-flag pattern currently playing out. While PLG can still continue to grind lower, a break to the upside of this pattern will give us an official SCOTCHstocks initial target of $9.30, with a possible overshoot.
Everything shared here is my own opinion and no results are guaranteed. Good luck!

Not all dumps come to harmMy portfolio is bleeding very badly, however the trades with BTC pairs can actually benefit from this crash. As you can see EMA 200 is below the chart (it's the same at 4h and at 1h the candles go up and down). For the moment we can assume that the trend is still bullish even because RSI is over 50%.
I'm sharing the daily chart because it's easy to see the chart's zig-zag inside the bull flag, even if the bouce upwards happened a little bit below the support I had drawn it happened and right now it seems there's an uptrend. Now, if BTC moves slowly this could help this trade, especially its price doesn't rise much.
I'm positive on this.
NNDM in a bull flag and could bounce from this double bottom NNDM on 4H:
RECENT NEWS:
NNDM Closes $500 Million Registered Direct Offering. NNDM intends to use the net proceeds for strategic opportunities such as acquiring new technologies to better their machines.
TECHINCAL OBSERVATIONS:
Currently NNDM is in a bull flag. NNDM tested resistance on 2/10 and pulled back. NNDM has the opportunity to bounce up from this support and double bottom. This could be a good swing play, I'm liking the potential risk to reward ratio. Don't sleep on this one.
SUPPORT AND RESISTANCE
Support: $13.30 | $13 | $11.50
Resistance: $17 | $17.80 | $18.95

$ADT long run setup$ADT in an elevation sequence with earnings next week. Looking beautiful for a run towards the top. Looks at this one closely.
Short Term Target: 12
Short Term Target: 13
#bullish #ADT


RSR in accumulation zoneAfter the bull flag break out price is all concentrated within this channel circumscribed by dashed yellow lines. As you can see the breakout happened after the bounce between 0.5 and 0.618 Fib lines so the bull flag was correct.
Despite indicators not giving much help in this phase I think that because of the bull market and because the project is very, very good this accumulation zone will burst up to a new high, probably the target of theprevious bull flag.
If you wanna enter I'd suggest to buy close to the bottom of the channel (while I write price is there) and set a stop loss at 0.05139

Seeing Machines chartThis share is still my favourite and my largest investment, and I am glad to see it in such a clear bull trend. I had so many options counted from the bottom, and the pictured is one of the most likely where the most impulsive move starts as a wave 1 and are finished with the subwave 3 of the wave 3 for that move. Further options are very similar just starting form the low and would include this entire move up as subwaves of the 3rd. Even if I dont account for any of the 5th wave extensions going forward the targets are well above the previous all time highs. Heading above ath is really just a blank canvas without real targets. People set it to 50p, £1 etc which are all possible fo rthe future ahead. The great thing about being in new ath, and making newer and newer ath`s is that nobody is unhappy, as there are just no losers who could possibly bought ever higher. This will push the sentiment and new investors to enter even more. I think the current setup is just ideal for any new entry here, as the sub wave 4 is finishing a possible triangle, touched the last E wave and is setting up for the 5th wave breakout.
There is just so much fundamental in this share that the potential news flow will be really continuous for this year ongoing.
I set the break of the previous ath to reach by half of the time the drop took from ath, this takes us to spring 2021. That would indicate strong bullishness to continue further upwards and extend those further impulsive waves.
I am still aiming to hold for a multibag in this year.
GLA

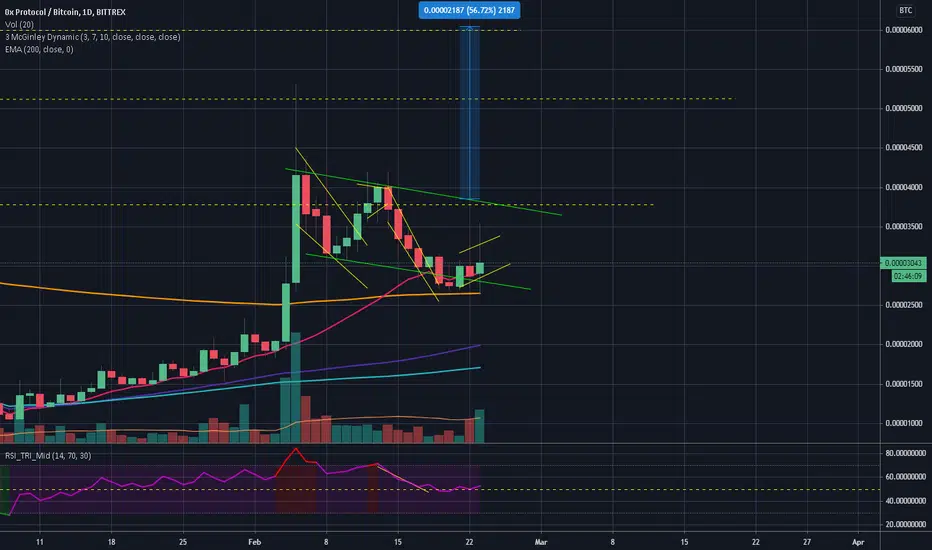
ZRX should bounce on a bull flag lower levelUnfortunately I can't post signals with multiple timeframe, however just know that the 2 green lines are bottom and upper level of a daily bull flag. In the falling channel you can see at 1h volume profile shows how price did a reversal on the control point (when many people entered the trade). Control point area coincide with 0.5 Fib retracement level (not shown) so it looks very fine!
I think that in this area is super safe up to 3200 sats, between 3200 and 3300 there's an uncertain area but if it goes over 3300 it should test the upper resistance (green line) and hopefully break out. You can see from the target there's a potential profit of +56% from there, if you enter at the bottom it's around +80%.
Trading BTC pair is kinda different from stable coins because it's like solving a 2 variables equation but once you make profit on this and you get BTC you realize it was worth. Remember, once a channel breaks is broken out price goes up and very commonly comes back to retest the upper level as a support. Don't sell in case you see the retracement as long as it stays in the support area.

CRSR bull flagging for next leg up?Accumulation has been occurring since November and CRSR has created a nice bull flag pattern. A strong volume shelf has been built up between $36-$40. The close today was right above the volume profile POC. Hoping to see upside momentum next week, with increasing volume. Will look for a break through of the bull flag and then possible re-test of the ATH at ~$51.50.

EGLD is in for another big run!Chart speaks clearly, I'm currently in UMA, 1INCH and ZRX and all are either exiting a correction or they're out but still quiet. I suppose that this is a phase of the market and very soon all these coins/tokens will start pumping.
This one is a good project, the moment it awakes again it'll do well I think.
SL at 139.57

NNDM Could be forming a huge bull flagNNDM forming giant bull flag prior to the announcement of a company acquisition.. time will tell.
