Bullflags

Possibly an Inverted H&S for Aleafia Health? In blue I have outlined a bullish flag or descending triangle, or possibly a falling wedge, it appears as though momentum is leaning towards the bears creating a series of lower highs, but the blue downward sloping line of resistance looks like it's about to be breached to the upside, and continued bullish price action could possibly create a inverted H&S pattern.
Only time will tell.

Bull Flag buy strategy.Hello Traders,
ADA / BTC trading idea
If you want to know the values of the entry point, stop loss, target, and position size, follow us!
Please like this post and comment.
You are welcome to follow us on our social networks.


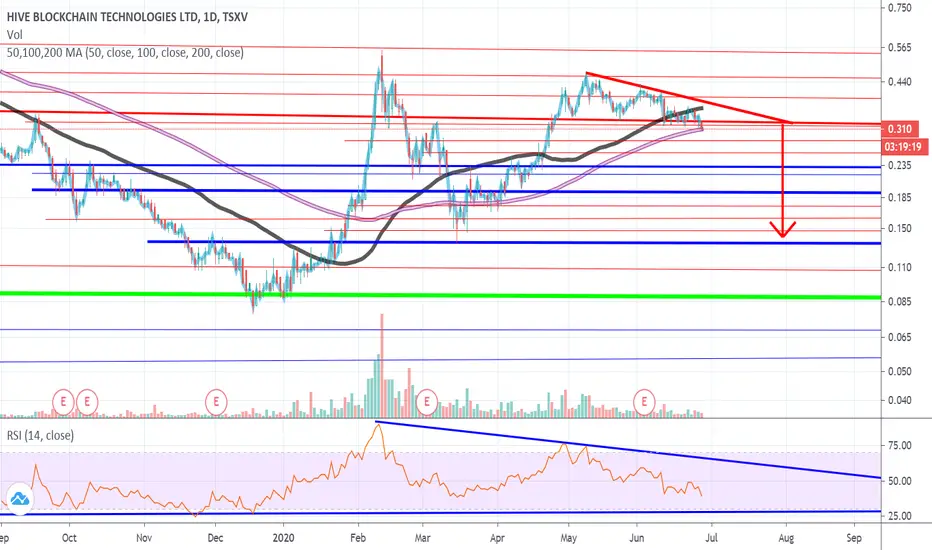
Descending Triangle breakdown for Hive?It's unlikely this plays out as a bullish flag because the baseline of support has been breached indicating the pattern is a descending triangle.
Does technical analysis still work on Bitcoin?🔸 I'm continuing my experiment. That time I'll try to figure out which tools of classical technical analysis are still working on Bitcoin.
🔸 In my last idea, I considered trendlines from which price periodically deviates to take liquidity:
📈 This time, my attention was drawn to the downward channel on BTC, which perfectly fits "bullish flag" pattern - continuation trend figure.
⚡️ According to the rules, after consolidation in the channel, price must break through the upper border of the flag and cover distance equal to the price movement before forming the pattern.
☝🏻 I don't use this pattern in my trading strategy. Just analyzing statistics of successful ones.

Weekly BTC/USD sell-offs topping off at the 10K - 11K region.After consolidating in a symetirical triangle (begining week of 24 Jun '19 to the break down week of 23 Sep '19) and falling -30% during a 4 week period, there were 3 more dumps. 21 Oct '19 thru 18 Nov '19 (-34%) 10 Feb '20 thru 09 Mar '20 (-62%) 01 Jun '20 thru 29 Jun '20 (-15%). (The -62% drop IMO would have been closer to a -30% drop if Covid-19 were not a factor). This leads me to believe the trend of sell-off's has smaller percentages of downside action. Price action alone looks to be bulllish, with the majority of closes above the $9K in the past 50 days. This sideways consolidation in price is what bulls are looking for. Of course we would like to buy some BTC around 7K or 6K but the bears are loosing steam. Buyers will step in during Q3.
Bitcoin has closed above the 21/50/100 week SMA since 27 Apr '20. However the 21 SMA is below the 50 currently. A break of the 50 sends BTC/USD to $8.5 area. Bad news could drive a wick down to $5.3K. I look for strong support at $6.3K on the monthly. The EMA Ribbon is slightly bullish, the MAC D looks bullish, the RSI is neutral at 55.00 and the Stock RSI is gaining momentum to the down side. A -25% drop in the comming weeks? an inverted head and sholders could start to take form.
BTC daily volume has been consoludating in the 15B - 25B range for weeks, and has recently dropped to 12B witch is the lowest daily Volume since 13 Oct '19. (Volume in this market is too hard to gauage) But I know full well that when BTC is trading with low volume..... BOOM! big up or big down. There's a potential Bull flag on the monthly. If it plays out a quick test of the $13.5K region is very likely.
Down the line when the stock markets finally crash new $ will enter the crypto space. There are too many projects showing success with real use cases and partnerships. Countries, banks and large business are just now realizing the benefits of blockchain.

Bitcoin in a Bull flag!Hey, I am back with another Crypto idea, looking at Bitcoin.
So Bitcoin has been going sideways for the past week, in a slight uptrend.
Currently is Bitcoin in a bull flag, from where it looks like it's breaking out now by breaking the bull flag downtrend line.
The target of this one hour bull flag is $9,400, rest of the cryptomarket should be bullish too, as Bitcoin looks bullish.
Make sure follow me, in order to not miss out on my trading ideas.
Each Like is very much appreciated! 🙌
If you have any questions, feel free to ask via dm or down in comments.

NIKE ($NKE) Bull Flag BreakoutNYSE:NKE bull flag breakout is about to happen. This time it may surpass the supply zone.

DeFi Scary BullflagScary bullflag on DEFIPERP, wants to trend along the outside of this fib spiral.
I recommend REP for a buy as they are releasing V2 in July.
DeFi holds promise from a TA perspective.

Trade Idea Completed, CHFJPY, Wedge Breakout PatternTrade Idea Completed, CHFJPY, Wedge Breakout Pattern, Target Price 114.004


Bullish Flag or Descending Triangle for BTC?Bitcoin appears to be trading in a bullish flag or a descending triangle, the bull flag is colored blue & the descending triangle pattern is red.

DE Bull Flag Breakout NYSE:DE is a ticker I have kept my eye on for a little now. It fell into sideways movement after maintaining a strong bullish trend. It formed a bull flag and broke out of the upper bound at the close of the 6.25 session. This is a strong breakout signal supported by a MACD crossover underneath the zero line. This, along with analyst price target upgrade to 165, involvement in agriculture sector that reaps benefit from the recent China Phase 2 deal, and potential 2 trillion dollar infrastructure aid, makes me believe that we may enter a strong bullish trend from this breakout. Keep your eyes peeled

$TECH - Seeing great bull flag breakout - Potential target $330With recent bull flag breakout on good accumulation, I see that $TECH has potential to rally up to $330.
50SMA(245) can be used as stop-loss limit.
P.S: Please do you additional research before investing, all ideas posted are for educational purposes.

Bullish Flag or Descending Triangle?Since the parabolic price movement to the upside which occurred after the stock split ACB has since consolidated into a bullish flag or a descending triangle.

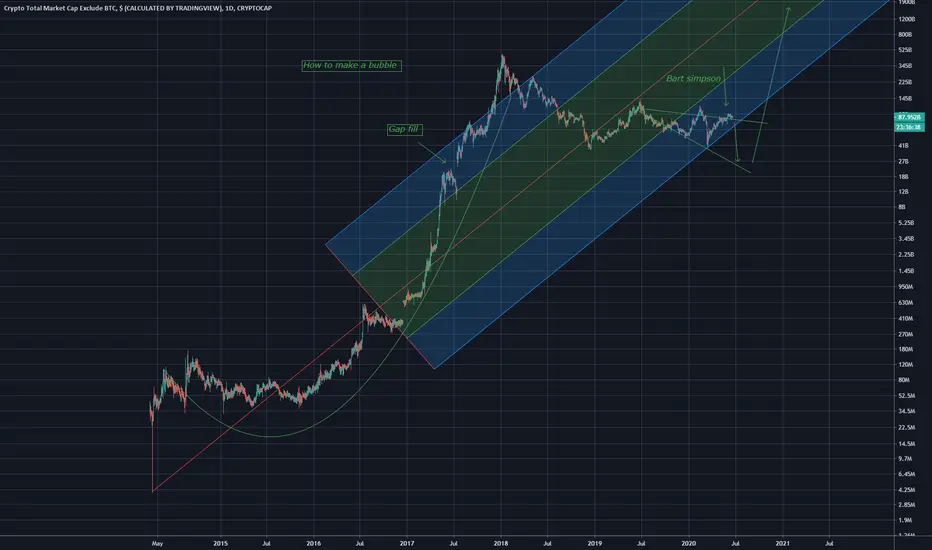
The only bearish scenario I can seeGap filler
since the altcoin market is intensely correlated with TOTAL, completely even
buy bitcoin and alts at 78B if this scenario occurs
EURUSD - LONG (Watch for breakdown of DXY)DXY is approach key reversal points. Will look for DXY to breakdown before taking LONG on EURUSD

Could EXPI be going further upEXPI is already trading close to 3 months high and has announced yesterday that they will be having an investor conference on 19/06/2020
It has quite recenty had a huge bull flag and now currently having a sort of consolidation period within the channel.
I'd say that the stock is getting prepared to go higher highs soon within the next 3 working days.
what do you guys think ?

Could EXPI be going further upEXPI is already trading close to 3 months high and has announced yesterday that they will be having an investor conference on 19/06/2020
It has quite recently had a huge bull flag and now currently having a sort of consolidation period within the channel.
I'd say that the stock is getting prepared to go higher highs soon within the next 3 working days.
what do you guys think ?

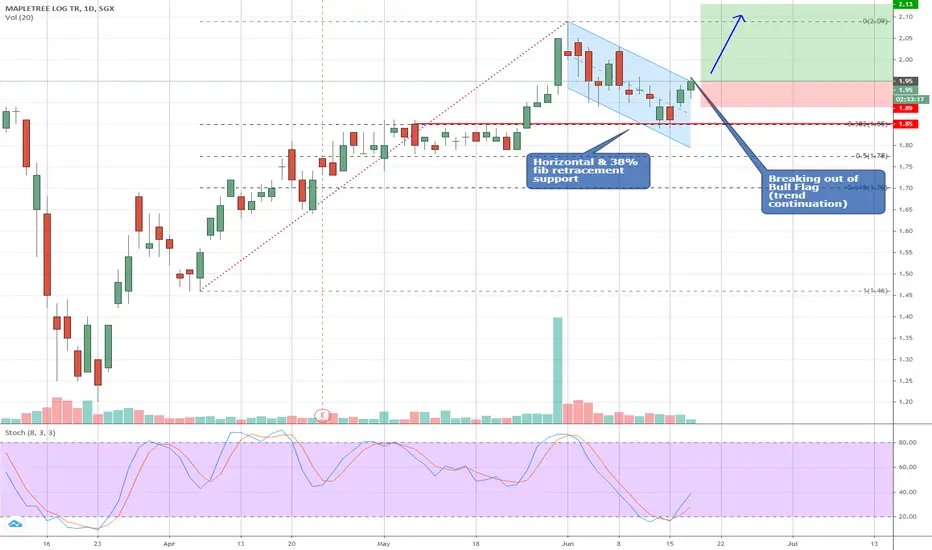
Mapletree Logistics Trust - breaking out of Bull FlagAfter hitting a high of 2.09 on 1st June, MLT has been consolidating in the past 2 weeks and forming a Bull Flag. The low was in place @ 1.84 (horizontal and 38% fib retracement support there).
It broke out of this Bull Flag @ 1.94 today and looks set to resume it's uptrend in the coming days. Expecting a retest of 2.08 although whether it could break this level in the near term remains to be seen
Long @ 1.95 with initial stop @1.89.
Disclaimer: This is just my own analysis and opinion for discussion and is not a trade advice. Kindly do your own due diligence and trade according to your own risk tolerance. Thank you.
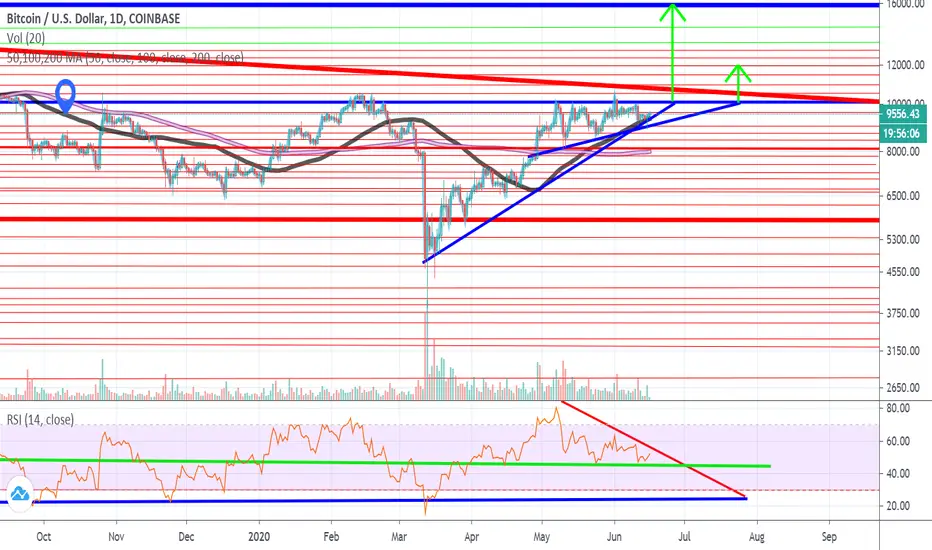
Macro Ascending Triangle or Micro Bull Flag.The head & shoulders pattern is still in play until the downward sloping resistance on the RSI is broken flush creating a higher high.
We may have seen a fake-out to the downside, only time will tell but the bullish patterns have not been negated.
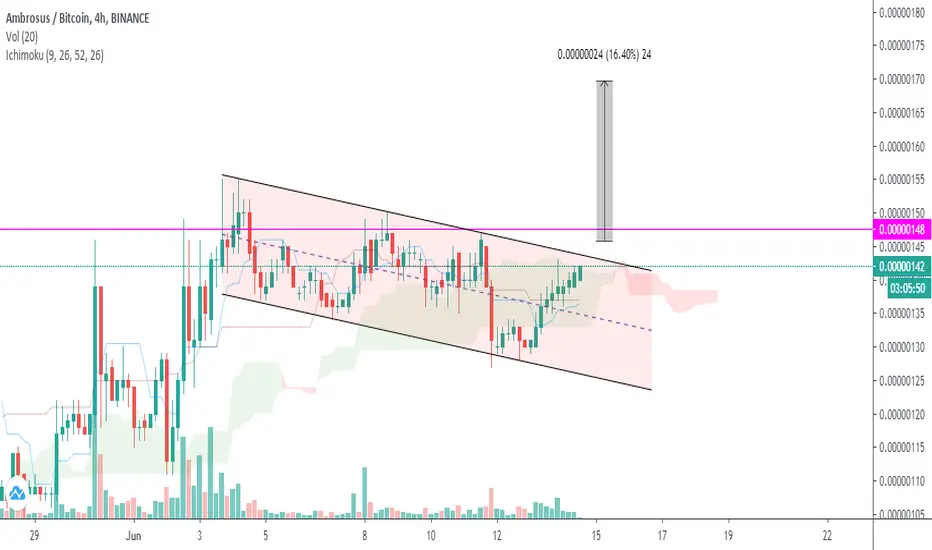
AMBROSUS Coin price in Bull Flagprice is ready to break above and also taking resistance at the kumo cloud if close above the kumo cloud than rally will be big in this coin.
looking for 15% to 30% in this coin once breakout the bull flag