Micro Bull Flag inside of a Macro Ascending Triangle?It appears as though Ethereum is reaching a point of no return, only time will tell.
Bullish flag formations are found in stocks with strong uptrends. They are called bull flags because the pattern resembles a flag on a pole. The pole is the result of a vertical rise in a stock and the flag results from a period of consolidation. The flag can be a horizontal rectangle, but is also often angled down away from the prevailing trend. Another variant is called a bullish pennant, in which the consolidation takes the form of a symmetrical triangle. The shape of the flag is not as important as the underlying psychology behind the pattern. Basically, despite a strong vertical rally, the stock refuses to drop appreciably, as bulls snap up any shares they can get. The breakout from a flag often results in a powerful move higher, measuring the length of the prior flag pole. It is important to note that these patterns work the same in reverse and are known as bear flags and pennants.
An ascending triangle is a chart pattern used in technical analysis. It is created by price moves that allow for a horizontal line to be drawn along the swing highs, and a rising trendline to be drawn along the swing lows. The two lines form a triangle. Traders often watch for breakouts from triangle patterns. The breakout can occur to the upside or downside. Ascending triangles are often called continuation patterns since the price will typically breakout in the same direction as the trend that was in place just prior to the triangle forming.
Notice a divergence on the RSI?
Bullflags

TOTAl2 BullflagBull flag while eerily close to fib transition
Golden cross also present on daily
Looks good for alts !

EURCAD 1D BULL FLAG LONG TRADEBull Flags are ranges that are repeatable trading chart patterns.
Bull Flag Range chart patterns will have a directional bias depending on the previous incoming trend.
Each chart pattern will have defining trendlines of the support/resistance levels creating the pattern.
Whatever time frame you are trading this chart pattern, wait for a candle close outside of the trendline in the direction of the breakout candle. (Our time frame preference is the Daily chart).
Add volume indicator - Volume is the amount of $ that went into a particular candle or in Forex the # of trades that took place.
Add ATR indicator - Volatility is the amount of price movement that occurred. Use the ATR to measure the price movement.
When you see descending Volume bars and descending ATR line (which indicates volatility) this shows
a dis-interest in traders to invest in this pair creating consolidation which creates the chart pattern.
Trade Management after there is a breakout candle close.
1 - Position size (compare volume bar to volume ma line).
a - Breakout candle must be 100% of average volume for a full position size.
b - If 75% of average volume then ½ position size. (To find 75% of Volume
look at the charts volume settings – divide smaller # into larger # = 75%+)
2 - Enter two trades.
3 - SL for both trades will be 1.5 x ATR.
4 - 1st trade TP will be 1 x ATR.
5 - No TP on 2nd trade – letting profit run and adjusting SL to follow price.
6 - When 1st TP hit – move 2nd trade SL to breakeven.
7 - Adjust the 2nd trade SL to follow price.
*8 – After Breakout candle – if price closes back into chart pattern close trade
*9 - When breakout candle is more than 1 ATR from breakout candle open.
a - Enter 1st trade at candle close with ½ position size.
b - Enter 2nd trade with a pending limit order that is 1 ATR of breakout candle open.
c – Price should pullback to that pending limit order for 2nd trade.
d – If Price returns back into chart pattern close trade before SL is hit.

Boeing is in the airSo things are looking up for the airline industry and Boeing is printing a nice bull flag. The flag is very ascending triangular in nature.
I'm already riding a trade from around $130 but I thought I would point this out for others to assess for themselves.


Bitcoin printing a Fib extension to $13,500? LOOKS LIKE IT!It looks like the pattern is starting to come into focus. It seems there are some clear impulse waves that match up with classic fib lines pointing to a wave 5 resolving around the $13,500 area.
Is this going to play out? It's unclear. Nothing is set in stone, however if Bitcoin breaks the top line of the bull-flag (Shown in the chart) it's currently in, then we can see a potential large push to the upside. This would not only break the mid term down trend, but also put in a higher high and create a definitive break of the macro downtrend (~$11,100 area). If it fails to do so on this attempt we risk not only breaking down to the bottom of the bull-flag, but also breaking the trend-line started in March. That would likely lead to lower prices (Possibly the $7000 range). All eyes are on the upper line of the bull-flag of $10,200. Cross your fingers!

Bearish Divergence invalidated by bull flag ABCjust example of divergence invalidate by bull flag ABC


XMRUSD bull flag!XMR USD is in a bullflag and confirmation is breaking $73.02 and closing above. Objective $92.02

Inverse Head & Shoulders breakout?The RSI is displaying a bullish flag pattern that is currently breaking the downward sloping resistance, meanwhile, the Inverted H&S pattern is noticeability visible on the RSI as well.

Bullish flag or Descending Triangle / Double Top?Hive appears to be trading in a Bullish Flag, or possibly a Descending Triangle with a Double Top to compliment the bearish narrative.

EURGBP - Longdouble bottom of flag approached there structurally with a 3 touch descending channel filtered on the 15M, risk entry on corrective candles or retrace candle

Ready For take off !Well as soon as MLB negotiations settle with players For July Start I think this one is off to the Races Being there will be not much else to do.. Wish i bought More...
Bullish Flag or a Bullish Pennant for TNY?Bullish flag formations are found in stocks with strong uptrends.
They are called bull flags because the pattern resembles a flag on a pole. The pole is the result of a vertical rise in a stock and the flag results from a period of consolidation.
The flag can be a horizontal rectangle, but is also often angled down away from the prevailing trend.
Another variant is called a bullish pennant, in which the consolidation takes the form of a symmetrical triangle.
The shape of the flag is not as important as the underlying psychology behind the pattern.
Basically, despite a strong vertical rally, the stock refuses to drop appreciably, as bulls snap up any shares they can get.
The breakout from a flag often results in a powerful move higher, measuring the length of the prior flag pole.
It is important to note that these patterns work the same in reverse and are known as bear flags and pennants.
What is a Pennant?
In technical analysis, a pennant is a type of continuation pattern formed when there is a large movement in a security, known as the flagpole, followed by a consolidation period with converging trend lines - the pennant - followed by a breakout movement in the same direction as the initial large movement, which represents the second half of the flagpole.
Bullish pennants, just like its name suggests, signals that bulls are about to go a-charging again.
This means that the sharp climb in price would resume after that brief period of consolidation, when bulls gather enough energy to take the price higher again.
Pennants are often continuation chart patterns formed after strong moves.
After a big upward or downward move, buyers or sellers usually pause to catch their breath before taking the pair further in the same direction.
Because of this, the price usually consolidates and forms a tiny symmetrical triangle, which is called a pennant.
Higher lows on the RSI & it is trading at approximately 52. Traditional interpretation and usage of the RSI dictates that values of 70 or above suggest that a security is becoming overbought or overvalued and may be primed for a trend reversal or corrective price pullback. An RSI reading of 30 or below indicates an oversold or undervalued condition.

Hemogenyx about to break up completing correctionHEMO is passing the scoop up zone touching multiple golden zones. Consider placing is at 7p, so this marks up the bottom of this sp. My targets are above 25p then 42p to complete wave3. Multibag potential here.

GBPNZD GBPNZD trades now in two different wedges, if top for orange wedge breaks then expect top of the greeen wedge tested, which is a good place to sell this pair.
P.s. on 4h TF last candle looks like bull flag.


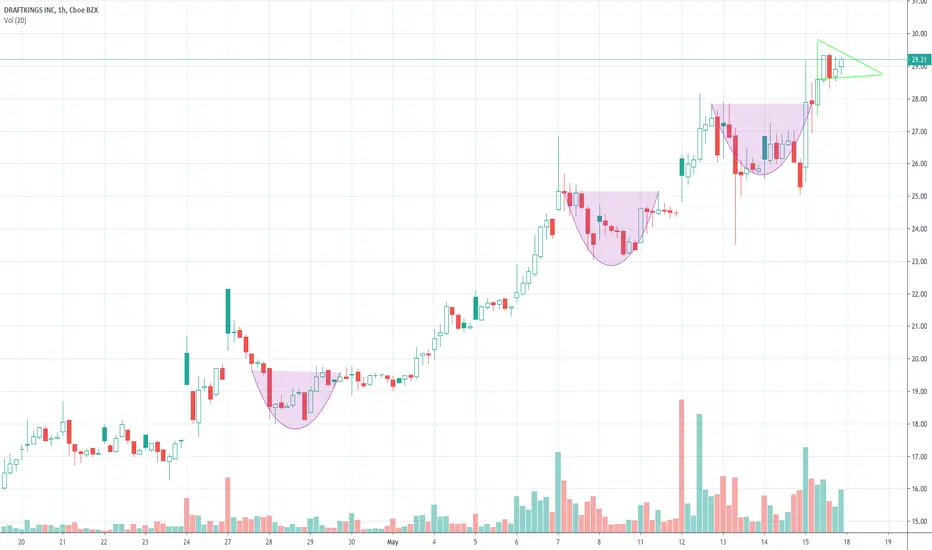
Bull FLAG Clear Bull Flag forming On the Hour ill continue to watch the formation enter on high volume at break of top of first pull back candle That has great volume with good level 2.. target @25

Bull Flag Forming on SPYWill have to see how Thursday closes. Good possibility it either breaks out or fails. Looking for the 3:30 big move that seem to have been happening lately every day like clockwork. FED, we see you )

Possible flag outcomesEstablished bull flag on spx . Watch for hourly candle close above resistance now... this would definitely point towards more up from here otherwise we will continue in the range for now

USD/CAD: Bull Flag activatedBull flag has been activated in USD/CAD, pointing to a move above $1.43.

Silver bull flag points to $17,3We could see here an upward move over the coming weeks. Thing is Gold also has a very bullish setup, so something might be up which will cause the rise in precious metals. Fact is coin mints aren't working and mines are shutting down all around the world. We'll see...
