NAKAUSDT Bullish Flag On Support LevelNAKAUSDT Bullish flag pattern sitting on top of horizontal level of support. Also, note the trendline support level. Expecting a breakout.
Bullflags

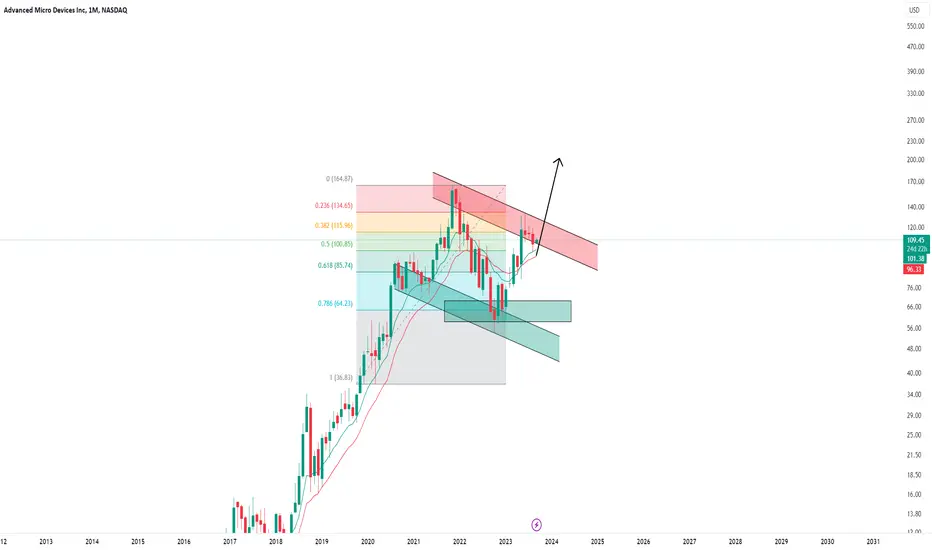
Adv. Micro Dev. (AMD) -> Breakout TimeMy name is Philip, I am a German swing-trader with 4+ years of trading experience and I only trade stocks , crypto , options and indices 🖥️
I only focus on the higher timeframes because this allows me to massively capitalize on the major market swings and cycles without getting caught up in the short term noise.
This is how you build real long term wealth!
In today's anaylsis I want to take a look at the bigger picture on Advanced Micro Devices.
Just 9 months ago - after a quite harsh drop of more than 60% - Advanced Micro Devices perfectly retested the 0.786 fibonacci retracement level and reversed towards the upside.
With the overall trend still being massively bullish I am now waiting for and expecting a bullish breakout of the current flag pattern with my upside target being the previous all time high.
- - - - - - - - - - - - - - - - - - - -
I know that this is a quite simple trading approach but over the past 4 years I've realized that simplicity and consistency are much more important than any trading strategy.
Keep the long term vision🫡
BCH/USDT Technical Analysis - Potential Breakout Ahead BCH/USDT Technical Analysis - Potential Breakout Ahead
Hey Crypto Enthusiasts!
Let's dive into an insightful technical analysis of the BCH/USDT trading pair, exploring recent trends and potential future moves for Bitcoin Cash (BCH) in the crypto market.
June's Phenomenal Surge
June was nothing short of thrilling for BCH holders, witnessing an incredible 260% surge in the BCH/USDT pair. This exhilarating jump has captured the attention of traders and investors, sparking curiosity about the path BCH might take next.
Spotting Bullish Signals
The current scenario hints at the formation of a bullish flag pattern in higher time frames. This pattern often acts as a signal for a continuation of the previous uptrend, suggesting the potential for more upward movement. However, remember that retracements are an integral part of the market cycle and should be anticipated.
Resistance and Support Levels
Right now, BCH/USDT is trading within the resistance range of $240 to $250. This zone is pivotal as it represents a battleground between buyers and sellers. Should the price breach the $250 mark, BCH could eye levels such as $300, $400, and even $500.
On the flip side, if the $250 resistance holds, we might see a retracement. In this scenario, the support level to watch is at $186. A dip to this level could provide a healthy correction and set the stage for the next bullish leg.
Breakout and Targets
The make-or-break point for BCH/USDT is at $250. A clean breakthrough here could unleash BCH's potential to explore $300, $400, and $500. Keep a close watch on this level, as sustained movement beyond it might herald a new bullish phase.
Key Levels Recap
Support: $186
Resistance: $250, $309, $400, $500
Remember: Cryptocurrency markets are known for their volatility. This analysis is purely informative and not financial advice. Always conduct thorough research or consult a financial advisor before making investment decisions.
Stay tuned for more updates!

Gold -> Wait For This Daily Setup!Hello Traders and Investors ,
my name is Philip and today I will provide a free and educational multi-timeframe technical analysis of Gold 💪
After the simply monthly break and retest and also a retest of the 0.382 monthly fibonacci retracement Gold perfectly created the bullish continuation towards the upside.
With the recent break and retest of a major previous weekly structure zone, in confluence with bullish moving averages, I simply do expect more growth on Gold over the next couple of weeks.
My last analysis on Gold - linked below - perfectly played out once again and I am now just waiting for a clear breakout of the bullflag and a break above resistance and then also the path on the daily timeframe is clear fore more upside.
Keep in mind: Don't get caught up in short term moves and always look at the long term picture; building wealth is a marathon and not a quick sprint📈
Thank you for watching and I will see you tomorrow!
My previous analysis of this asset:

DE could breakout only if....?NYSE:DE is trying to hold above to break out of its bull flag. This is one of the companies that a lot of investors would run to if there's a sector rotation out of tech. With a 1.19% dividend and potential growth ahead, you could see DE attempt to test the resistance around 418.
Bullish Case - There is little to argue in favor of a bear case for this ticker today. With the bull flag at the brink of a breakout, if not already breaking out, this could be a 425 ticker in a short amount of time. I would like to see the price above 408.39 to take a safe entry to the upside and consider profits at 418.
Bearish Case - The sell-off at the end of the day could signal that the market is exhausted when it comes to DE. If it breaks the level of 397.06, we could see an attempt to fill the imbalance below to 400 or as low as 390. Right now, this looks like a failure swing for the upside when it pushed back down below the bull flag breakout.
Conclusion - DE is in a bit of a no man's land. When it pulled back, it formed what could be the beginnings of a harami candle pattern. Though you could argue this could be a breakout retest, it's too close for comfort, making the bear case seem more relevant. It's safer to take the trade above 408.39 than to be too presumptuous. We have to see where it goes from here.
Bullish above - 408.39
Bearish below - 397.06

Continuation of the uptrendCurrently in an area of indecision as seen at previous periods of time. If Bullish sentiment remains we will most likely see the formation of a bull flag on the daily with a potential breakout to the up side.

Bullish ScenarioBased on Elliott Waves and Fib levels. Also there is a bull flag and pennant .
Invalidation limit: 4.11.
I am not a financial advisor and this is not financial advice. It is a potential scenario or opinion. Invest at your own risk and do your own research.

Bullish ScenarioBased on Elliott Waves and Fib levels. Also there is a bull flag and pennant.
Invalidation limit: 4.11.
I am not a financial advisor and this is not financial advice. It is a potential scenario or opinion. Invest at your own risk and do your own research.

Unity Bull flag. Watching for follow through.Just wanted to update where the chart is this morning, I like the pre market action.
Happy Trading!
OnePath

Bitcoin CME Futures Gap Filled!Traders,
One more negative indicator has been eliminated. You'll remember that in yesterday's post I pointed out this gap created a couple of days ago. 99% of all gaps are filled, and they are usually filled sooner rather than later. To have our gap to the downside filled so quickly is rather bullish IMO. We now have a new pivot high on our daily charts on Bitcoin as well as many/most altcoins, and we are forming what appears to be bull flags on many of these same charts.
Stay tuned as always. You know where to follow me for all the latest trades. I don't always post everything here.
Stew


HSY - Bull FlagHSY emerged from an 11-month sideway consolidation on 15th March and began a strong uptrend since.
A bull flag is now apparent there could be opportunity to trade the breakup (if it materialises). However, the trend is rather extended at the moment hence it is prudent to trade a smaller size at this juncture.
Disclaimer: Just my 2 cents and not a trade advice. Kindly do your own due diligence and trade according to your own risk tolerance and don't forget that money management is important! Take care and Good Luck!


Bull flag on GOLD?Hello
Gold is forming a bull flag . Target 2140-2180 .
10EMA on daily is supporting the price nicely. As long as that holds , I'll stay bull .
$2075 is golds ATH were we can see some resistance .
Also gold has been forming this MASSIVE cup and handle for 11 years . Which would suggest that gold will go for a longer bull cycle . Maybe even double in a few years
Check out my january "I think bitcoins bottom is in" analysis
-Jebu

ATAT - BullflagA bullflag has formed on this hourly chart for ATAT
This bullflag has clearly got a flag and a flag pole, all we are waiting for is the breakout
A higher low double bottom gives rise to an attempt out of the flag channel

Just some past charting I did that I never published!Bullflag buildup of liquidty then short baised due to divergence and other technical patterns. - Ascending wedge .

XRP owners don't care what the FED says, or does!Since the FED was created in 1913 the US Dollar has lost it's gold and silver backing, is printed out of thin air and has lost over 98% of its value. No matter what these shysters attempt to do, it doesn't make any difference at all because XRP holders know that the Dollar is going to "ZERO... ZERO!"

XRP is flagging like a boss on the 15.After XRP's epic bull-run style move today, new trends will be forming moving forward. And, it looks like the trend is getting started off right as it's currently flagging like a boss on the 15 min.

Will BTC reach 30K+ or it will dump? BTCUSDT updateHi dear community my loyal followers, I hope you are fine.
Let me update BTC current situation and my expectation.
This week BTC pumped from 19.5K and broke not only 24K but also 25.2K and reached 27.8K. If you remember I warned you about BTC recent dump from 25K to 19K+-.
At the moment, you can see on the chart that BTC has created Bullish megaphone chart pattern/Inverted symmetrical triangle/ and tested its upper line where there is significant, one of the strongest resistance/.. There are BB, FVG zone, 0.38 fib level, 21 monthly EMA, diagonal resistance+ horizontal resistance/ etc. Look at bellow attached charts also to understand what I mean.
I expect BTC to break 1h bull flag reaching 28.6K/attached bellow/ , which will be fake breakout of bullish megaphone chart pattern / a lot people will open long positions, at the same time BTC sweeps liquidity above 27.8K then we' will see strong rejection and correction starts. When BTC reaches 28.6K , BTCD will be at 48-48.5K at main resistance/attached bellow/, where it will drop and during this BTC correction , we'll see mini altseason.
Pay attention that volume is decreasing while price is rising/bearish divergence/ also there is bearish divergence at daily OBV which doesn't support this pump)). I expect BTC to drop 22.6-22.8K where there is OB+FVG + 0.618 Fib zone, if BTC can't hold the mentioned zone it will dump to 20.5K. During this drop price will react at 25.2K small bounce, then drops to 0.5fib level/23.6K/ again bounce/this level could hold as well/ and drops to 22.6-22.8K taking out IDM/sweep liquidity/
Also keep your eyes at 23.6K 0.5 fib level, which is mid range of megaphone chart pattern. there is chance it can hold as well, but more likely 22.6-22.8K will be reached.
After the mentioned scenario we'll see new highs, at the moment I can't tell you 22.6-22.8K will hold or not, we'll see BTC reaction at that point.
Please don't forget to like, follow and share my ideas. I will appreciate any kinds of support.

Potential Bull Flag on GBPAUD! Bullish continuationAfter the cup and handle I called looks like we are still in a bullish continuation. Previous Daily candle might be a bit bearish, but keep an eye out on what the next daily closes at in the next 5 hours!

NLST $3.71 TargetNLST has continued to rally since the the break out on 2/13,
The RSI spiked at 85 before retreating out of oversold territory and closing just over 70. This is very bullish.
Price closed above the 2.61 Fibonacci level on higher than average volume after testing the prior gap at $2.55
Price will likely find support at $2.55 and currently appears likely to make a bull flag/pennant pattern.
Short term target $3.71

$AUDIO - Bull Flag breakout @ Daily TFMusic token $AUDIO spent days consolidating forming bull flag and now breaking out of it. It still need some more volume thrust to give us a clear picture for entry, maybe once it crosses yesterday's closed price of 0.3690 we can go in it. Till then I will an eye on the price direction and the volume factor.
