$ELY - Bull Flagging into DemandTo all my friends watching the masters, this company shouldn't be a stranger to you.
Although $ELY is currently in a pretty gnarly downtrend, we're approaching a strong demand zone established back before the Covid crash.
This ticker looks ripe for a reversal, and I'll be eyeing this 20-21.5 zone to load some commons / leaps.
Bullflags

Bitcoin Looking Bullish !!!!!Let's start with the parallel channel formed since Jan 2022 (Red parallel channel). BTC has been moving within this channel till now. Important to notice is the Orange downtrend line breakout (orange circle) and then retest at the trendline yesterday (7/04/2022). Next, notice the short term bullish flag forming (blue bullish flag). BTC showed some bullish momentum when it made the 2nd bottom touch in the bull flag, retested the trendline and bounced back up.
If BTC maintains the momentum and can break out of the short term bullish flag, Major resistance at 48k and then the parallel channel we can see a massive pump towards 56-58k. Watch out for the massive resistance and pullback if we reach there.
This is not financial advice please DYOR

1INCHUSDT is creating a bullflagThe price is creating a bullflag above the daily support on 1.86$ after a retest of 0.618 Fibonacci level.
The price needs new momentum and need to create a new breakout from the 1.91$ key level
How to approach?
IF the price is going to have a breakout from the bull flag and 4h resistance, According to Plancton's strategy , we can set a nice order
–––––
Keep in mind.
🟣 Purple structure -> Monthly structure.
🔴 Red structure -> Weekly structure.
🔵 Blue structure -> Daily structure.
🟡 Yellow structure -> 4h structure.
–––––
Follow the Shrimp 🦐

GRTUSDT is creating a bullflagThe price is creating a bull flag after a breakout from the daily resistance as I told you on the previous analysis.
On 4h timeframe, the price is testing the 0.618 Fibonacci level on the daily support..
How to approach?
The price needs to have a new breakout from the bullflag with volume. Be careful to the 0.43$ resistance, it's a monthly resistance. According to Plancton's strategy , we can set a nice order
–––––
Keep in mind.
🟣 Purple structure -> Monthly structure.
🔴 Red structure -> Weekly structure.
🔵 Blue structure -> Daily structure.
🟡 Yellow structure -> 4h structure.
–––––
Follow the Shrimp 🦐

EGLDUSDT is creating another bullflagThe price created a triple bottom on the 129$ area on the daily timeframe and after the breakout from the weekly resistance (164$ the price had a nice bullish impulse until the daily resistance on 200$
The market is testing the static and the dynamic resistance on that level and non the 4h timeframe the price is creating a bull flag as well
How to approach?
Th price needs to create a new breakout from the bullflag and static resistance on 203$ and the market needs to satisfy our rules before new long position. According to Plancton's strategy , we can set a nice order
–––––
Keep in mind.
🟣 Purple structure -> Monthly structure.
🔴 Red structure -> Weekly structure.
🔵 Blue structure -> Daily structure.
🟡 Yellow structure -> 4h structure.
–––––
Follow the Shrimp 🦐

BTC formed Bull Flag on 1H with potential breakdown to 50-51KFriends,
I would like to share with you my trading idea - a potential bull flag with a breakdown of 50-51K. Let's consider the following factors except for the classic bull pattern we observe.
1. After the last breakdown and ranging trading volume has significantly decreased which means power accumulation.
2. Meanwhile Volume Profile shows that the accumulation at 47100 during the current range was significant compared to the past accumulation at 41000
3. Reaction on 50MA: in the past, we observed how the price impulsively breakdown 50MA after testing it from the bottom.
Last but not least, RSI and Stochastic oscillators are cool off enough for the next move up.
This month I've already successfully predicted another bull flag which had played out perfectly, please check the related idea below.

AXSUSDT is creating a bull flagthe market tested the weekly resistance on 72$ after a nice breakout on the dynamic daily resistance.
On the 4h timeframe the price is creating a bullflag below it, and the price could retest again the weekly support on 61.60$
At the moment the price is suffering about the hack.
Axie Infinity (AXS), the native token of the eponymous videogame, reversed most of its recent rally after hackers stole more than $600 million from the Ronin Network blockchain that runs the game. RON, the native token on the blockchain, also slumped in value.
How to approach?
The price needs the breakout from the bullflag on the 4h timeframe, we could see a retest on the 0.618 Fibonacci level where the market has the weekly support. SO if the price is going to have a breakout from the bullflag, According to Plancton's strategy , we can set a nice order
–––––
Keep in mind.
🟣 Purple structure -> Monthly structure.
🔴 Red structure -> Weekly structure.
🔵 Blue structure -> Daily structure.
🟡 Yellow structure -> 4h structure.
–––––
Follow the Shrimp 🦐

Looking for a Bull Flag breakoutHello Friends!
If Axie Infinity can breakout from this bull flag, I like it to target 2 price points:
-$81.93
-$88.97
For this to have a chance to happen, it needs to hold above $64.50.
As always thanks for your follows, likes, and comments. Let’s learn and grow together. Cheers!
*This information and publication is not meant to be, and do not constitute, financial, investment, trading, or other types of advice. Do your own research.

CRK: BULL FLAG BREAKOUT, NAT GAS PLAYCRK
Comstock Resources, Inc., an independent energy company, engages in the acquisition, exploration, development, and production of oil and natural gas primarily in North Louisiana and East Texas, the United States.
The Russian invasion of Ukraine has brought some tensions in international markets.
With Russia being a major source of natural gas , oil, raw materials, metals and other commodities , the Russia-Ukraine crisis could affect the supply of these materials to the world and cause major inflation.
I believe that buying gas companies is a good hedge.
From a technical point of view, it's a bull flag waiting to break out. If it does, look for 11 as first target .
If it does not break out immediately, look for more range bound within the flag.
I'm long CRK and UNG. Swing trades.
Trade safe and don't forget your stop loss!

BCE Is taking off againBCE has shown moderate growth, but recently price has broken out of this large bullflag that has formed
Growth is about to increase a lot, this is a great entry point
The 200MA is always just roughly below price when it shoots up


USDJPY on an ascending triangle?USDJPY on the daily chart is moving between a daily resistance and an ascending trendline creating a potential ascending triangle.
The ascending triangle is known as a continuation pattern so after. confirmation we can look for an upside trend.
I can spot in the last candles a potential bull flag too before the price continues to the resistance structure.
A minor concern of the continuation might be given by the descending trendline in purple that the market is currently trading around.
How can we approach this scenario?
I will wait for the European market to open and check for a possible break above the resistance.
In that case i will be looking for a long order according to Plancton's strategy rules.
–––––
Follow the Shrimp 🦐
Keep in mind.
🟣 Purple structure -> Monthly structure.
🔴 Red structure -> Weekly structure.
🔵 Blue structure -> Daily structure.
🟡 Yellow structure -> 4h structure.
⚫️ Black structure -> <4h structure.
Here is the Plancton0618 technical analysis , please comment below if you have any question.
The ENTRY in the market will be taken only if the condition of the Plancton0618 strategy will trigger

GMT/USDTWill go long in case of breakout upper trendline of the pennant. Only if volume increases above average though. target would be $0.80 but since i like to be sure I will set TP at $0.78. Lets see how this plays out.
Feel free to give feedback!

XRPUSDT is creating a bullflag 🦐the price got a rejection from the monthly resistance on 0.91$ after a bullish impulse.
After that, the price created a bullflag above the daily resistance on 0.70$ where the price retested the 0.618 Fibonacci level
On 4h Timeframe, the price is in the accumulation Phase below the monthly resistance on 0.77$
how to approach?
I'm monitoring the price, I'd like to see a clear breakout from the bullflag.
After the breakout I could see a rejection from the 0.78$, it's a monthly one.
If the price is going to have a breakout of it and satisfy my rules, I can Open a new long position with a very nice risk reward.
––––
Keep in mind.
🟣 Purple structure -> Monthly structure.
🔴 Red structure -> Weekly structure.
🔵 Blue structure -> Daily structure.
🟡 Yellow structure -> 4h structure.

Bull Flag Double Bottom Looking for 27% Potential UpsideWe are Double Bottoming within a Channel showing Bullish Divergence and if we Breakout we could see around a 27% pump.

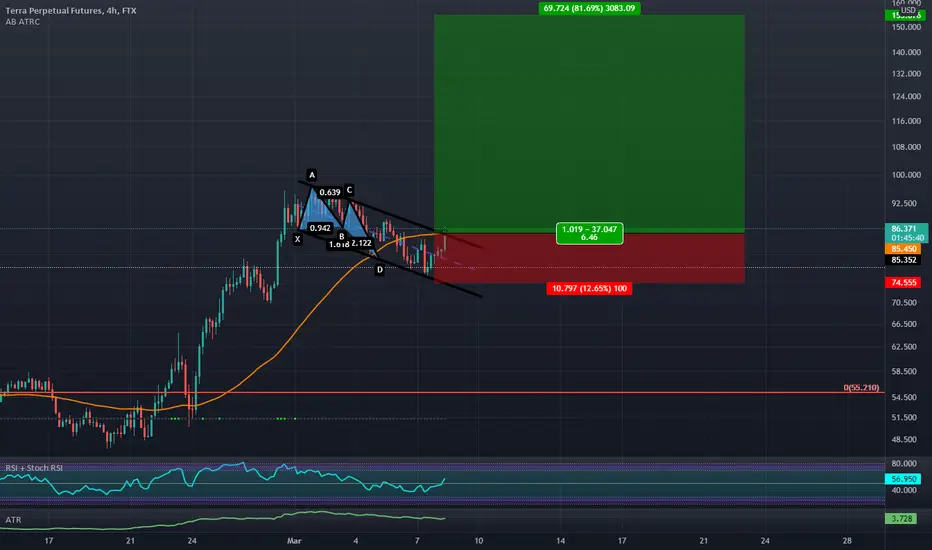
TERRA LUNA Breaking out of Bull Flag Targeting $150We bounced from a Bullish Butterfly at the bottom of a channel and are now breaking the Channel and if targets are reached we will be seeing $150
LUNAUSDT is testing the 80$The price had a breakout from the descending channel from the daily timeframe and now the market is testing the 80$ as new resistance.
On the 4h timeframe the price is creating a W pattern and we could see a retest of its neckline around 0.5 - 0.618 Fibonacci level before the new bullish impulse.
How to approach?
We are monitoring the price, if the market is going to have a clear breakout from the 80$ resistance and flip into new support, we can apply our rules for a new long position.
If the price is going to have a retracement until 0.5 - 0.618 Fibonacci level, we can wait for a bounce a look for a new long position.
–––––
Follow the Shrimp 🦐
Keep in mind.
🟣 Purple structure -> Monthly structure.
🔴 Red structure -> Weekly structure.
🔵 Blue structure -> Daily structure.
🟡 Yellow structure -> 4h structure.

BTC NEXT MOVEI think we will see where BTC is going within the next 20 hours (my guess is in the next 8hours but who knows...).
I have my technical targets shown on this chart. I'm currently sidelined looking to get a decent short entry.
Volume on HTF doesn't justify this breakout to be sustainable (imo). Lot's of bearish divergences on RSI even on the daily. Break my violet line (45704.22$) and close above and I'll be sidelined + not looking to short.
However, with all these potential black swans I won't long at the moment.
If this happens to be a so called bull flag, which I heavily doubt, I could see us touching the upper zone of my resistance box which would mean (51579.45$), a very long way to go, but you never know with BTC.
Note that there is a CME gap in the 42k area as well. My system tells me 42.5k area before another bigger move (this would also line up with the EMA50 on the 4H which could act as support).
I have much more to say, but let's keep it "short"!
Note that this is NOT Financial Advice, I'm just sharing my view and looking to have discussions in the comments! Still learning everyday!

Bull Flag to 3500 ETHthis is my thought. We will reload at or near 2910 and then take off to 3500-ish first chance to brake up above is 4pm , last chance is 7am on the 4th. I say about 75% this will happen.
DISCLAMER: Nothing I post or say should be taken as trading or investing advice. Never trade or invest more than you are willing to lose.

Up, up and away!The coffee futures have broken today the bullish flag, and this derivate on coffee follows the coffee price accordingly. Maybe in the following days, a pullback is possible, reaching 3,71 or the vicinity of the broken trendline below.
According to the seasonality and inflation, I expect a general bullish trend in coffee until the end of the year. But buying this instrument and holding it until the end of the year could be difficult because of the volatility decay. Take care!

Breakout Imminent?! Bitcoin is trading at a tight range right below the current resistance levels. This is a bullish sign because it shows that the buyers are willing to step in closer to resistance. With that being said, I can see a breakout soon to the upside but in case it goes the opposite direction you can see the next support shown on the chart.
Don't trade with what you're not willing to lose. Safe Trading, Calculate Your Risk/Reward & Collect!
Love it or hate it, hit that thumbs up and share your thoughts below!
This is not financial advice. This is for educational purposes only.

US100 long(Mitigation of an order block plus a bull flag)Price is mitigating a 4-hour order block while making a bull flag. This is an indication that the price will probably go up for now.

TSLA FlAGZ !!! 15min++<3TSLA bullflag?? this is the 1hr TSLA chart.. complete with my supply and demand zones intraday..i am seeking to strike this potential break out with momentum we could get 950 & some? not financial advice!!
