DEXE/USDT: FALLING WEDGE BREAKOUT!!DEXE Breakout Alert – 80% Move Loading?
Hey Traders! If you're into high-conviction plays and real alpha — hit that like and tap Follow for trade setups that actually deliver.
DEXE has broken out of a falling wedge pattern on the daily timeframe and has successfully retested the breakout level. The structure looks strong, and momentum is starting to build.
Entry Zone: $13.4 – $14.4
Targets: $16.1 / $18.2 / $21.2 / $24.4
Stop-loss: $12.60
Leverage: Use low leverage (Max 5x)
This could be the beginning of a powerful upward move.
Keep this setup on your radar and manage risk accordingly.
Let me know your thoughts or if you're riding this one too.
Bullish Patterns

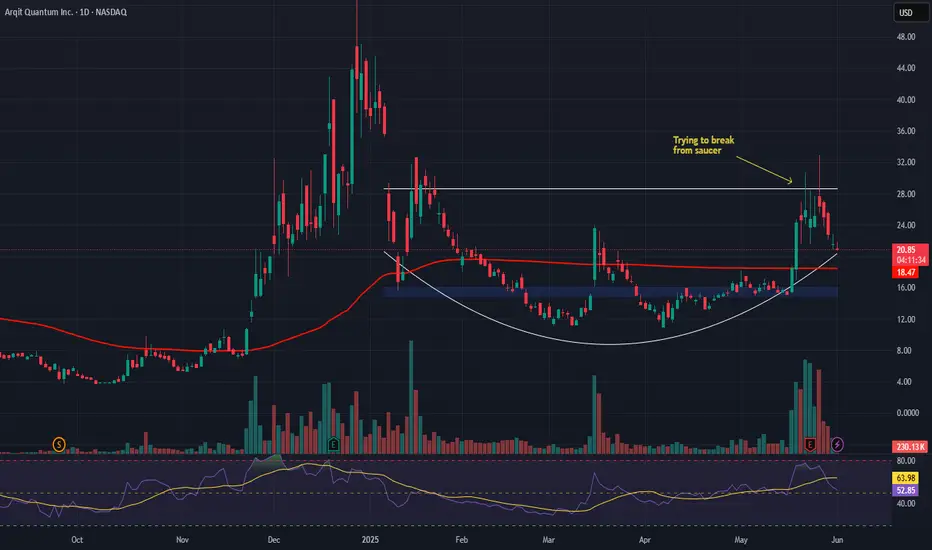
Arqit Quantum Inc. (ARQQ) – Securing the Future of DataCompany Overview:
Arqit NASDAQ:ARQQ is redefining cybersecurity by offering quantum-resilient encryption solutions—future-proofing critical communications infrastructure for governments, enterprises, and hyperscale cloud networks.
Key Catalysts:
Strategic Acquisition of Ampliphae 📡
Adds a powerful risk management suite + experienced innovation team
Expands Arqit’s capability to serve end-to-end encryption needs across cloud, edge, and IoT systems
Government Validation & Traction 🏛️
Multi-year license deal with a government client in EMEA
Signals institutional confidence, even with deferred revenue accounting
Quantum Threat = Rising Demand 📈
As quantum computing advances, the need for quantum-safe encryption becomes urgent
Arqit’s cloud-based QKD platform is uniquely suited to meet these demands at scale
Enterprise-Grade Solutions 🌐
Positioned to become a go-to cybersecurity partner for mission-critical infrastructure in a post-quantum world
Targeting global clients across finance, defense, telecom, and more
Investment Outlook:
✅ Bullish Above: $15.00–$16.00
🚀 Upside Target: $43.00–$44.00
🔒 Key Drivers: Strategic M&A, government adoption, quantum-resilient tech, first-mover advantage
Arqit isn’t just building encryption—it’s building the cybersecurity foundation for the quantum era. #ARQQ #QuantumSecurity #FutureProof
Crypto Market Slows Down For A Correction Within UptrendCrypto market nicely slowed down as expected and Crypto TOTAL market cap chart can now be finishing a projected wave 4 correction right at the former wave "iv" swing low and channel support line, which is ideal textbook technical picture that can now send the Crypto market higher for wave 5, especially if bounces back above 3.3T area and channel resistance line.
However, even if it's going to face deeper and more complex correction within higher degre wave (2) down to 3.0T - 2.8T area, sooner or later we can expect a bullish continuation, as Crypto TOTAL market cap chart is not at the all-time highs yet.

GBP/CAD BEST PLACE TO BUY FROM|LONG
Hello, Friends!
We are now examining the GBP/CAD pair and we can see that the pair is going down locally while also being in a downtrend on the 1W TF. But there is also a powerful signal from the BB lower band being nearby indicating that the pair is oversold so we can go long from the support line below and a target at 1.866 level.
Disclosure: I am part of Trade Nation's Influencer program and receive a monthly fee for using their TradingView charts in my analysis.
✅LIKE AND COMMENT MY IDEAS✅

GOLD LONG FROM SUPPORT
GOLD SIGNAL
Trade Direction: long
Entry Level: 3,281.17
Target Level: 3,348.67
Stop Loss: 3,236.17
RISK PROFILE
Risk level: medium
Suggested risk: 1%
Timeframe: 7h
Disclosure: I am part of Trade Nation's Influencer program and receive a monthly fee for using their TradingView charts in my analysis.
✅LIKE AND COMMENT MY IDEAS✅

LRC, LOOPRING, HOW MANY LOOPRINGS DO YOU THINK SONIC COULD EAT?Something is going on with this coin on the technical side.
There is literally no downside target that I can see right now, so I just labeled in MASSIVE SUPPORT TREND.
It looks like it is really close to making a move to the upside.
Somewhere around .8
Then it will likely hit some resistance there, but has a lot of potential to keep building support and climbing.
This coin looks incredibly bullish right now.
Things can change fast and if they do it will likely be a break of this trend (green).
The run up can take it to .45 and maybe a little higher, but the buy the dip price looks to be around .245. which would then take price higher to over 1 and beyond.
I'm gonna go with 3684 looprings for sonic.
What even is a loopring?
I'll attach more crypto TA to this idea.
oh and don't follow the guideline, pay more attention to the trends and price zones.

Altseason started Bullish from this chart cup and handle. Consider to see this breakout.
This ill be the start of Altseason, Bitcoin will pump .. others will follow.. 250X incoming & 15 Trillion MCAP

BITCOIN BULLS WILL DOMINATE THE MARKET|LONG
BITCOIN SIGNAL
Trade Direction: long
Entry Level: 104,686.94
Target Level: 111,091.02
Stop Loss: 100,407.14
RISK PROFILE
Risk level: medium
Suggested risk: 1%
Timeframe: 9h
Disclosure: I am part of Trade Nation's Influencer program and receive a monthly fee for using their TradingView charts in my analysis.
✅LIKE AND COMMENT MY IDEAS✅

SEIHead and Shoulder Pattern is seen in the chart,
Breakout of Neckline will give a huge pump 🚀🚀🚀
Can grab some here 💰

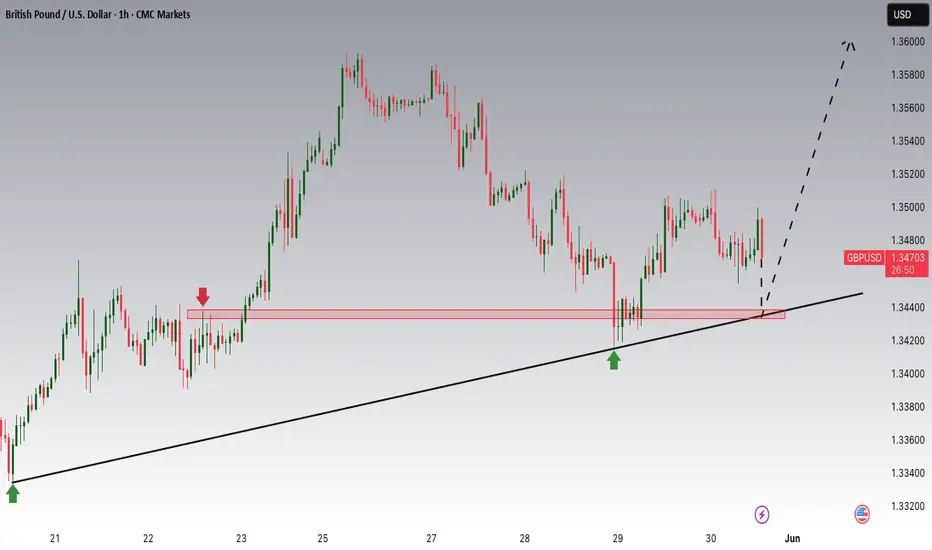
GBPUSD is Nearing an Important Support!!Hey Traders, in today's trading session we are monitoring GBPUSD for a buying opportunity around 1.34400 zone, GBPUSD is trading in an uptrend and currently is in a correction phase in which it is approaching the trend at 1.34400 support and resistance area.
Trade safe, Joe.
Render – Re-Entry Opportunity After Hitting First TargetRENDER hit the first take profit target (TP1) with a ~52% gain — great execution. Now, after the expected pullback, price is approaching a key support zone, offering a second swing trade opportunity.
🔹 Entry Zone:
Around $4.00 support
🔁 Previous resistance turned support
🧭 Psychological level and structural base
🎯 Take Profit Targets:
🥇 $4.80 (recent local high / resistance)
🥈 $5.40 (next significant supply zone)
🛑 Stop Loss:
$3.69 (below key support & invalidation level)

Toast, Inc. (TOST) – Powering the Future of RestaurantsCompany Snapshot:
Toast NYSE:TOST is cementing its position as the go-to restaurant operating system, offering integrated solutions for payments, POS, inventory, and guest engagement—all tailored for food service businesses.
Key Catalysts:
Recurring Revenue Powerhouse 💸
ARR hit $1.7B in Q1 2025 — up 31% YoY
SaaS-driven model provides high visibility and stickiness
Expanding Client Base & Network Effects 📈
Serving ~140,000 locations, up 25% YoY
More locations = richer data + stronger product improvement + increased client lock-in
Enterprise-Grade Momentum 🏢🍔
Wins with Applebee’s (~1,500 locations) and Topgolf demonstrate Toast's scalability
Validates ability to support complex, high-volume operators
Operating Leverage in Motion ⚙️
As ARR scales, margins improve—positioning Toast for profitable growth over time
Investment Outlook:
✅ Bullish Above: $37.00–$38.00
🚀 Target: $60.00–$62.00
📈 Growth Drivers: Enterprise adoption, recurring revenue, SaaS scale, network effects
💡 Toast is becoming the digital backbone of modern restaurants—serving up growth with every seat. #TOST #SaaS #RestaurantTech

Gold Strong Pullbacks But Long Term Image Still Bullish!!!Hey Traders, in today's trading session we are monitoring XAUUSD for a buying opportunity around 3,200 zone, Gold is trading in an uptrend and currently is in a correction phase in which it is approaching the trend at 3,200 support and resistance area.
Trade safe, Joe.

NZD/CHF LONG FROM SUPPORT
Hello, Friends!
The BB lower band is nearby so NZD-CHF is in the oversold territory. Thus, despite the downtrend on the 1W timeframe I think that we will see a bullish reaction from the support line below and a move up towards the target at around 0.495.
Disclosure: I am part of Trade Nation's Influencer program and receive a monthly fee for using their TradingView charts in my analysis.
✅LIKE AND COMMENT MY IDEAS✅

USD/JPY BEST PLACE TO BUY FROM|LONG
USD/JPY SIGNAL
Trade Direction: long
Entry Level: 143.655
Target Level: 145.800
Stop Loss: 142.221
RISK PROFILE
Risk level: medium
Suggested risk: 1%
Timeframe: 3h
Disclosure: I am part of Trade Nation's Influencer program and receive a monthly fee for using their TradingView charts in my analysis.
✅LIKE AND COMMENT MY IDEAS✅

BUY GOLDIn todays session we are monitoring GOLD for buying position. Our entries are at 3295 and targets are above 3361. Our stops are below 3278. Use proper risk management. Good luck to you all.

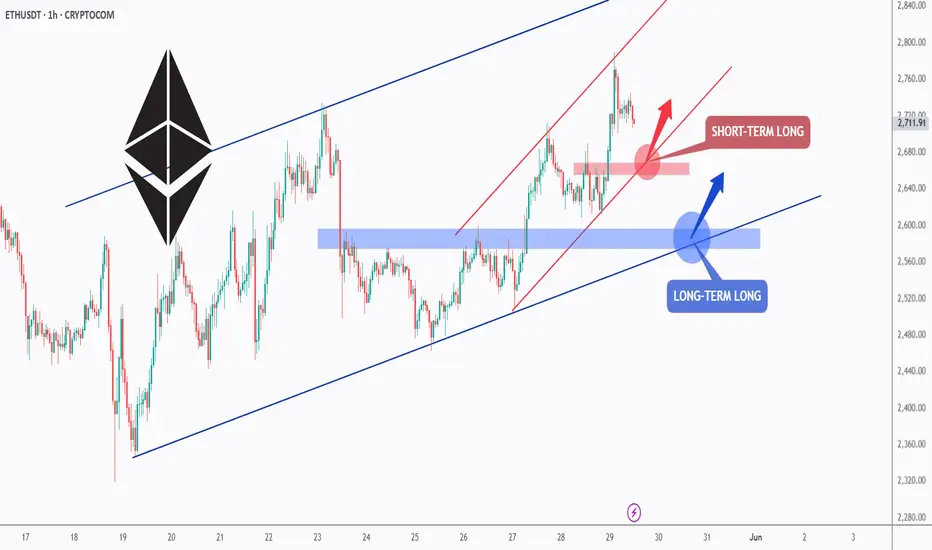
ETH - Long Anyway, Short-term and Long-term!Hello TradingView Family / Fellow Traders. This is Richard, also known as theSignalyst.
📈ETH has been overall bullish trading within the rising blue channel from a long-term perspective and within the rising red channel from a short-term perspective.
Moreover, the red and blue zones are strong support and structure!
🏹 Thus, the highlighted blue and red circles are strong areas to look for buy setups as it is the intersection of the lower zone(s) and trendline(s).
📚 As per my trading style:
As #ETH approaches one of the circles, I will be looking for bullish reversal setups (like a double bottom pattern, trendline break , and so on...)
📚 Always follow your trading plan regarding entry, risk management, and trade management.
Good luck!
All Strategies Are Good; If Managed Properly!
~Rich
$TOTAL Crypto Market Cap BREAKDOWN You don't want me to draw the squigglets that come after if it plays out like this 🥸

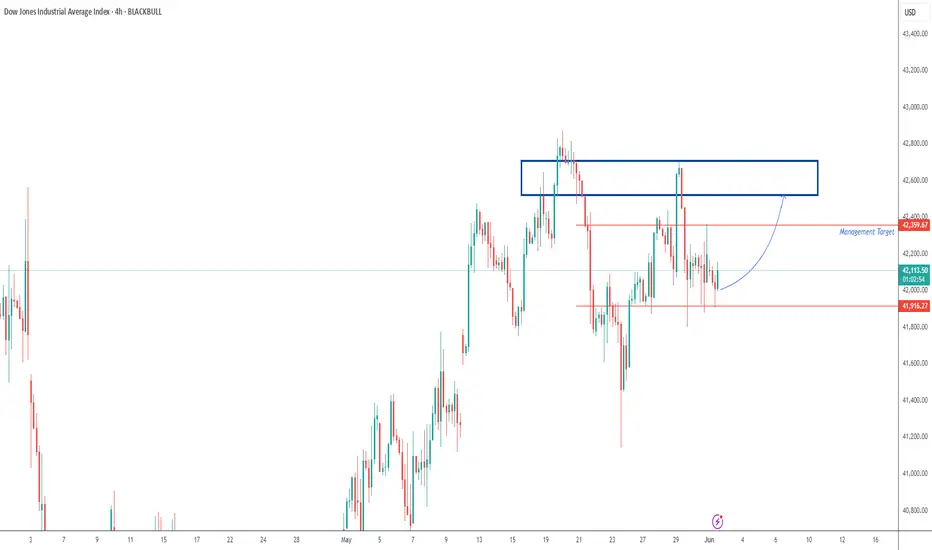
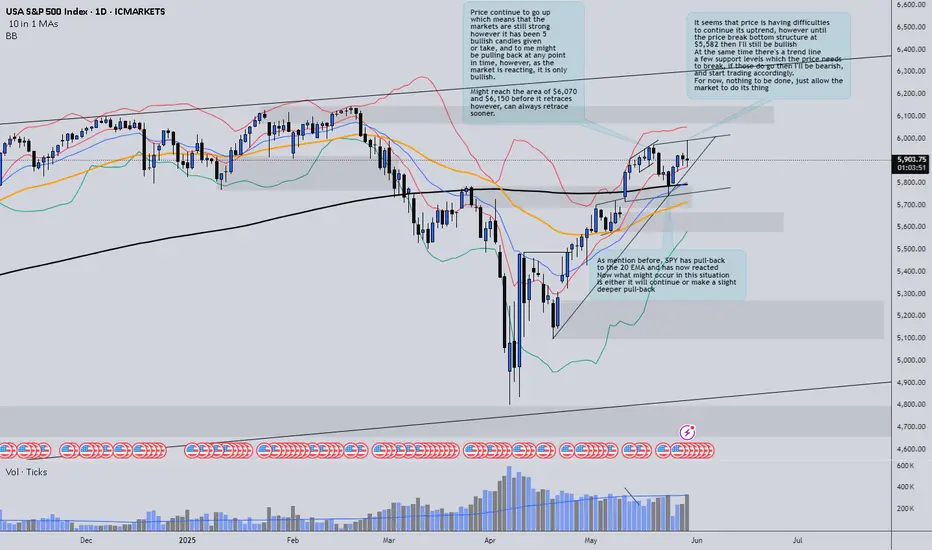
SPY update - still bullish!In today’s session, we saw an increase in volume without significant price movement. This could indicate underlying uncertainty or a potential shift in momentum.
At the moment, price is still respecting a key trend line and several support levels. Until these are broken, it's too early to confirm whether the broader market is turning bearish.
🧠 I also want to point out that the price is forming an ascending channel, often a reversal pattern, especially when occurring at market highs. While we’re seeing some bearish signs, it’s crucial to remain patient and let the market show its hand.
📊 As always, the key is to observe, not assume, and be ready to adapt as the price action develops.
Thanks for watching the update, I hope it brought some insight and value to your trading journey!
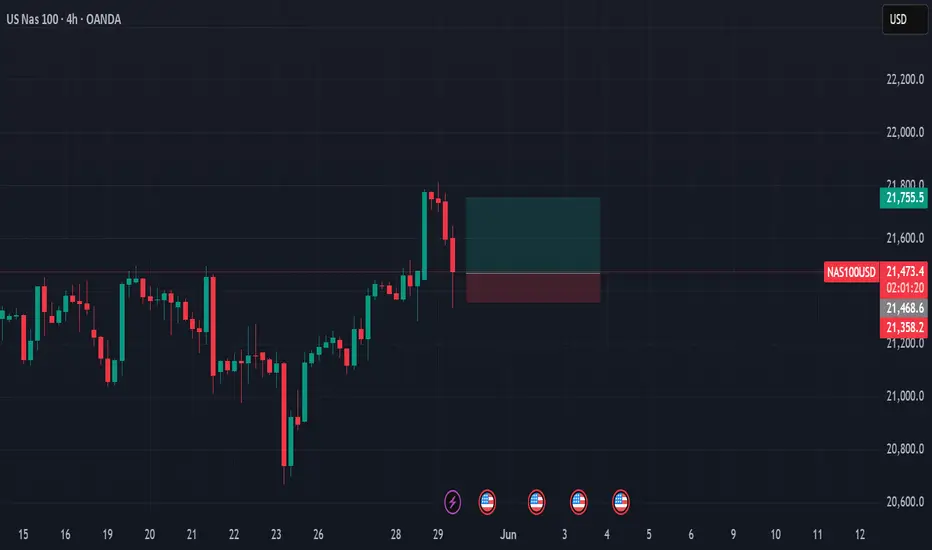
4hr break and retestgoing long here, price action is nice and simple
i am aiming for a 50 percent retracement to or close to the gerneral price action where it has previously broke out
USOIL - Bullish Double BottomHello Traders !
The USOIL price formed a double bottom pattern.
Currently, The neckline is broken !
So, I expect a bullish move🚀
_______________
TARGET: 63.49🎯

Ethereum is Approaching a Key Support!Hey Traders, in today's trading session we are monitoring ETH/USDT for a buying opportunity around 2,650 zone, Ethereum is trading in an uptrend and currently is in a correction phase in which it is approaching the trend at 2,650 support and resistance area.
Trade safe, Joe.
