CADJPY - NEW BREAKOUT !Hello Traders !
The CADJPY price formed a descending channel.
Currently, The resistance line is broken !
So, I expect a bullish move🚀
_______________
TARGET: 105.390🎯
Bullish Patterns

Potential ETH IH&S Continuation (4H)BINANCE:ETHUSDT might be forming an Inverse Head & Shoulders on the 4H chart.
• A right shoulder around ~$2400 would complete the pattern
• Confirmation comes with a breakout above the $2730 neckline
• Measured move target: ~$3130
Keep an eye on ~$2800 – it's a key daily/weekly S/R that could provide strong resistance and possibly stall the breakout.
In a No-Trade Zone until either a bounce from $2400 or a break above $2730.

Bitcoin is Nearing a Key Support Level!!!Hey Traders, in today's trading session we are monitoring BTCUSDT for a buying opportunity around 107,000 zone, Bitcoin is trading in an uptrend and currently is in a correction phase in which it is approaching the trend at 107,000 support and resistance area.
Trade safe, Joe.

WLD (Worldcoin) – Long Spot Trade Setup After 180% RallyAfter a massive 180% surge, WLD is showing signs of exhaustion and is likely to retrace toward the next major support zone. A pullback into the $1.22 – $1.35 area provides a favorable entry opportunity for continuation of the trend, assuming support holds.
🔹 Entry Zone (Support):
$1.22 – $1.35
🎯 Take Profit Targets:
🥇 $1.65 – $1.85 (prior consolidation and resistance zone)
🥈 $2.40 – $2.65 (upper range resistance / extension target)
🛑 Stop Loss:
Just below $1.10 (below structural support and invalidation level)

Credo Technology Group (CRDO) – Powering the AI Data Center BoomCompany Snapshot:
Credo Technology NASDAQ:CRDO is a rising star in AI infrastructure, delivering high-speed, low-power connectivity solutions that are mission-critical to modern data centers.
Key Catalysts:
AI Infrastructure Tailwinds 🧠🏢
Direct exposure to Active Electrical Cables (AEC) and PCIe retimers
Positioned for rapid demand acceleration from AI, cloud, and hyperscale data centers
AEC chip market expected to grow 15x from $68M (2023) to $1B+ by 2028
Sticky Software + Hardware Model 🧩
PILOT software platform offers real-time diagnostics and performance tuning
Enables a recurring revenue model and strengthens customer retention
Scalable, Energy-Efficient Portfolio ⚡🌐
High-bandwidth, low-power design aligns with sustainability goals of large data centers
Integrated solutions are already seeing early adoption momentum
Investment Outlook:
✅ Bullish Above: $51.00–$52.00
🚀 Upside Target: $90.00–$92.00
📈 Growth Drivers: AI infrastructure demand, software expansion, chip market scale
💡 Credo isn’t just riding the AI wave—it’s building the rails for it. #CRDO #AIInfrastructure #Semiconductors

NIFTY 1W forecast until August 2025India's stock market is correcting now. The correction will be short and not deep - just a normal retest of 24,500 but should not make a weekly close below 24,250 during the first half of June 2025.
A major bullrun will start in the middle of June 2025. Slowly at first, but explosive during summer.
It will find its top in August 2025 at the level of 27,800
Here I publish 1W charts, for weekly 1D charts check my profile for more ways to keep in touch

DOTUSD📊 30m Analysis – DOTUSD
Strategy: 🐊 Alligator Strategy
Trend: 📈 Strong Uptrend
📝 Trade Plan
🎯 Entry Point (EP): 4.603
🛡️ Stop Loss (SL): 4.530
💰 Take Profit 1 (TP1): 4.680
💰 Take Profit 1 (TP1):4.75
Risk Reward 1:1 TP1
Risk Reward 1:2 TP2

PNUTUSDT – Breakout Brewing from Bullish Pennant!PNUT Bullish pennant Formation – 200%+ Potential Incoming?! 👀🔥
Hey Traders! If you're all about high-conviction plays and real alpha, smash that 👍 and tap Follow for more setups that actually deliver!
PNUT is consolidating inside a bull pennant after a massive 200%+ rally earlier this month. Currently, it's sitting near the lower support zone, forming higher lows—a sign of growing pressure for an upside move.
🔍 Setup Highlights:
Bull Pennant forming
Strong bounce zone (green box)
Potential breakout path marked in projection
📌 Trade Idea:
Entry: $0.31–$0.28 support zone
Targets: $0.39 / $0.46 / $0.55 / $0.72
SL: Below $0.27
Leverage: 5x–10x (only for experienced traders)
Keep a close eye—once PNUT clears the triangle resistance, things could move fast.
What are your thoughts?

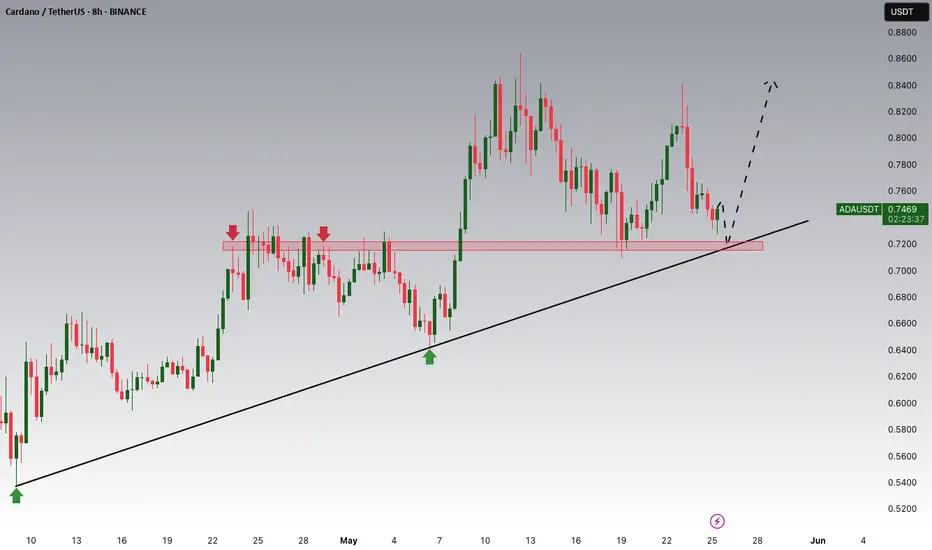
Cardano Potential UpsidesHey Traders, in today's trading session we are monitoring ADA/USDT for a buying opportunity around 0.7200 zone, Cardano is trading in an uptrend and currently is in a correction phase in which it is approaching the trend at 0.72000 support and resistance area.
Trade safe, Joe.
$TJX with a bullish outlook following its earnings #StocksThe PEAD projected a bullish outlook for NYSE:TJX after a negative under reaction following its earnings release placing the stock in drift D with an expected accuracy of 50%.

$INTU with a bullish outlook following its earnings #StocksThe PEAD projected a bullish outlook for NASDAQ:INTU after a positive under reaction following its earnings release placing the stock in drift A with an expected accuracy of 71.43%.

$CSCO with a bullish outlook following its earnings #StocksThe PEAD projected a bullish outlook for NASDAQ:CSCO after a positive under reaction following its earnings release placing the stock in drift A with an expected accuracy of 75%.

$WMT with a bullish outlook following its earnings #StocksThe PEAD projected a bullish outlook for NYSE:WMT after a negative over reaction following its earnings release placing the stock in drift C with an expected accuracy of 66.67%%.

$HD with a bullish outlook following its earnings #StocksThe PEAD projected a bullish outlook for NYSE:HD after a positive over reaction following its earnings release placing the stock in drift B with an expected accuracy of 80%.

Bitcoin Hits New All-Time Highs — Rally Targets $130K+Bullish Momentum Accelerates:
Bitcoin has reached new all-time highs, confirming a strongly bullish technical outlook. Accelerating upside momentum and growing investor confidence are driving the current rally.
Breakout Confirmation:
A decisive breakout from a broadening wedge pattern has unlocked potential targets in the $130,000–$135,000 range, signaling a likely continuation of the uptrend.
Key Support Levels:
With Bitcoin now trading well above $106,000, the previous resistance at $108,000 is expected to act as strong support during any pullbacks — providing a clear risk threshold for traders.
Favorable Risk-Reward Setup:
This alignment of:
Strong momentum
Completed consolidation
Successful breakout
...creates a compelling risk-reward scenario and reinforces the case for continued upside in the current bull cycle.
Bitcoin may just be getting started on its next leg higher. 🚀🔥
#Bitcoin #BTC #AllTimeHigh #Crypto #TechnicalAnalysis #Bullish #Breakout #MarketMomentum #CryptoTrading #CryptoMarket

ETH ANALYSIS🔴 #ETH Analysis : ❓❓
🔮There is a formation of "Bullish Pennant Pattern" in #ETH in 4HR time frame. We can expect around $2800 bullish move if the price break the pattern.📈
⚡️What to do ?
👀Keep an eye on #ETH price action. We can trade according to the chart and make some profits. ⚡️⚡️
#ETH #Cryptocurrency #Breakout #DYOR

AUD/CAD SENDS CLEAR BULLISH SIGNALS|LONG
Hello, Friends!
AUD-CAD downtrend evident from the last 1W red candle makes longs trades more risky, but the current set-up targeting 0.893 area still presents a good opportunity for us to buy the pair because the support line is nearby and the BB lower band is close which indicates the oversold state of the AUD/CAD pair.
Disclosure: I am part of Trade Nation's Influencer program and receive a monthly fee for using their TradingView charts in my analysis.
✅LIKE AND COMMENT MY IDEAS✅

JTO Approaching Breakout Point – Watch This Wedge!🚀 JTO Falling wedge Formation – 100%+ Potential Incoming?! 👀🔥
Hey Traders! If you're all about high-conviction plays and real alpha, smash that 👍 and tap Follow for more setups that actually deliver! 💹💯
JTO has been consolidating within a falling wedge on the daily timeframe for months and is now approaching the apex of the structure.
The price has shown strong demand around the $1.85–$2.00 support zone and is now attempting to push above the wedge resistance trendline.
Technical Highlights:
Falling wedge formation, typically a bullish pattern
Support holding firm at the $2.00 psychological level
Potential for a breakout retest and continuation if volume confirms
Trade Setup
Entry: CMP and add more in the green box(up to $1.8)
Targets: $2.48 / $2.84 / $3.30
Stop Loss: Below $1.85
Risk-to-Reward: Well-structured setup with defined invalidation
A confirmed breakout from this structure could open the door for a strong upside move. Keep an eye on volume and market momentum for confirmation.
What do you think about this? Share your views in the comment section.

GUN/USDT: FALLING WEDGE BREAKOUT ALERT!!🚀 GUN Falling Wedge Breakout – 35%+ Potential Incoming?! 👀🔥
Hey Traders! If you're all about high-conviction plays and real alpha, smash that 👍 and tap Follow for more setups that actually deliver! 💹💯
GUN has officially broken out of the falling wedge structure on the 2H timeframe — a classic bullish reversal pattern. 🚨
Right now, it's retesting the breakout zone, which is a key confirmation step before the next leg up. If this retest holds, we could see a strong continuation move soon.
📊 Technical Setup:
✅ Falling wedge breakout
🔄 Retesting resistance as new support
🎯 Targets:
TP1: $0.053
TP2: $0.057
TP3: $0.061
TP4: $0.067
🛑 Stop-Loss: Below $0.046
⚙️ Leverage: 5x–10x (use proper risk management)
This is the make-or-break moment — if the retest holds, GUN could fire off big. Stay sharp.

Failed Wedge, New Setup. Is SUI About to Break Out?In my previous post about BYBIT:SUIUSDT , I mentioned a potential falling wedge pattern. However, the breakout above the 4.0040 resistance turned out to be a false breakout, and the price eventually dropped to the invalidation level at 3.5868. This made the setup invalid.
But despite the failed wedge breakout, BYBIT:SUIUSDT remains in a bullish trend overall. During the current consolidation, the price appears to be forming a new bullish pattern — a Descending Broadening Wedge (DBW).
This pattern typically starts with low volatility and gradually widens. Once price reaches its lower boundary, it often experiences a strong breakout to the upside.
Let’s break down the key price action in this DBW setup:
Price is moving within a Descending Broadening Wedge and is currently near the lower boundary of the pattern.
It’s also sitting around a key support level at 3.4833.
A rejection candle formed right at 3.4833, showing the market’s response to this support area.
A reversal confirmation would come if the price breaks above 3.6102.
A bullish divergence is also visible — price is forming lower lows, while the stochastic indicator is forming higher lows.
Based on these five price action signals, it seems that buyers are still in control, even though short-term volatility has created a series of lower lows.
That’s why I still believe BINANCE:SUIUSDT has more room to go up. What’s your take on this?

BULLISH GOLDIn todays session we are observing GOLD for buying opportunities. Our entries are at 3328.73, targets is 3402 and stops below 3310.5. Use proper risk management. Cheers gang

BNB will rest after reaching 1000BNB has successfully bounced back from the support area and heading towards the next resistance which is around 900-1000. This target is easily achievable for BNB since is fundamentally strong and BNB ecosystem is heavily used.
I'm expecting BNB to reach 1000 in 3rd of this year.
Follow Our TradingView Account for More Technical Analysis Updates, | Like, Share and Comment Your thoughts.
Cheers
GreenCrypto

doge buy midterm"🌟 Welcome to Golden Candle! 🌟
We're a team of 📈 passionate traders 📉 who love sharing our 🔍 technical analysis insights 🔎 with the TradingView community. 🌎
Our goal is to provide 💡 valuable perspectives 💡 on market trends and patterns, but 🚫 please note that our analyses are not intended as buy or sell recommendations. 🚫
Instead, they reflect our own 💭 personal attitudes and thoughts. 💭
Follow along and 📚 learn 📚 from our analyses! 📊💡"
