LTC (Litecoin) – Swing Long Setup from Support ZoneLTC is currently pulling back into a key support area between $89 – $96, which has historically provided strong bullish reversals. The zone aligns with a potential higher low on the daily timeframe, making it a solid area for a risk-reward favorable swing long.
🔹 Entry Zone:
$89 – $96 (structural support and previous demand zone)
🎯 Take Profit Targets:
🥇 $133 – $146 (key resistance and prior local highs)
🥈 $180 – $190 (macro range highs and psychological barrier)
🛑 Stop Loss:
Hard stop at $80 (clear break of structure and invalidation of higher low)
Bullish Patterns

Gold H4 Technical update and key levels bulls/bears📊 Technical Outlook Update H4
🏆 Bull Market Overview
▪️stuck in range for now
▪️overhead resistances will limit upside
▪️Bears key S/R: 3410/3460 USD
▪️Bulls key S/R: 3160/3240 USD
▪️Expect range price action
▪️Focus on selling high / buying low
▪️volatility likely to remain low
▪️next few weeks as no major headlines
⭐️Recommended strategy
▪️short high and buy low
▪️detailed price levels above
▪️right now no trade recommended
Latest gold market updates:
📈 Gold surges as renewed tariff threats and geopolitical tensions drive safe-haven demand.
💳 Fiscal concerns escalate after the U.S. credit rating is downgraded, increasing investor interest in gold.
📊 Analysts identify $3,300 as a crucial support level, with strong buying interest keeping prices elevated.
🔮 Major banks project gold to surpass $4,000 per ounce within the next year, citing robust demand from both investors and central banks.
💍 Record gold prices prompt jewelry designers to shift toward 14-karat gold and alternative materials to control costs.
📉 Gold jewelry demand in India continues to decline due to high prices, while investment gold purchases rise.
🌍 Central banks, especially in emerging markets, sustain gold purchases to hedge against currency volatility and inflation.
🛡 Gold maintains key support above $3,200 despite market volatility and profit-taking pressures.
📈 Leading investment banks remain bullish, forecasting significant upside for gold through year-end.
💰 Gold is currently trading near $3,358 per ounce, reflecting ongoing volatility and global economic uncertainty.

NEARUSDT📊 1H Analysis – NEARUSDT
Strategy: 🐊 Alligator Strategy
Trend: 📈 Strong Uptrend
📝 Trade Plan
🎯 Entry Point (EP): 2.835
🛡️ Stop Loss (SL): 2.713
💰 Take Profit 1 (TP1): 2.962
Risk Reward 1:1

Daily BTC OverviewThe daily chart in its simplest form can be broken down into this range. Since President Trumps inauguration, BTC has declined from a range high of $108,000 back to the lows of $74,500 closing the FVG caused by the US election rally. After a double bottom Bitcoin mean reverted back to the range midpoint which to me is the most important area on the entire chart because it decides if the bull run can continue or if it dies.
I like to keep a close eye on the 200 EMA on multiple timeframes but the 1D is important to gauge the momentum of the move. As the US election results came in a massive push away from this moving average causes the level to steepen in its climb showing strength. Since BTC spent quite some time in the top half of the range the 1D 200 EMA flattens out signaling a loss of momentum, once this level does become flat it no longer provides support. For a bullish cycle to be just that ideally the corrective moves do not spend too much time below this level before expanding above and beyond it once again starting the next leg of the move. A persistent move down below causes a rollover and the cycle looks to be over with a bear market beginning.
Bullish scenario - The correction is over and BTC consistently posts HH's & HLs bringing the 1D 200 EMA up with price and continues the previous bullish trend. I would want to see the retest of the midpoint be successful and then move to reclaim the next local high before targeting range high. The bull market correction looks to be over and bullish continuation resumes.
Bearish scenario - This move is nothing more than a LH, BTC wicks the supply above midpoint, swing fails back under and continues to make LH's & LL's back down to range low where the 1D 200EMA will have now rolled over providing more of a resistance level. The bear market looks to have begun.
I am not here to make a call on where BTC is going next as I do not have that answer, but I do have to plan for each eventuality and that is what I have done here from a TA pint of view. Now it is entirely possible that Geo-political news or an exchange hack etc throws TA out of the window and I have to rethink the plan but in a strictly chart structure perspective this is how I see it.
The indicator "TRADING ENVIRONMENT+V1.0" used in the Idea post is now publicly available for use, give it a try and leave your thoughts and suggestions on the post, thank you.

JUP/USDT: Classic Inverse Head & Shoulders Breakout!🚀 JUP Inverse Head and Shoulder Breakout – 80% Potential Incoming?! 👀🔥
Hey Traders! If you're all about high-conviction plays and real alpha, smash that 👍 and tap Follow for more setups that actually deliver! 💹💯
JUP is breaking out of a textbook Inverse Head and Shoulders pattern on the 12H timeframe — signaling a strong bullish reversal after a long downtrend.
🟢 Pattern: Inverse H&S
📊 Breakout Confirmation: Neckline flipped into support
🎯 Target Zone: $1.05+
🛡️ Invalidation: Close below $0.534
Momentum is shifting, and bulls seem to be back in charge. If this pattern plays out fully, we’re looking at a potential 70%+ move from current levels.
Let the chart speak. Keep this one on your radar!

EURUSD - Important Breakout !Hello Traders !
The EURUSD price formed a descending channel.
Currently, The resistance line is broken !
So, I expect a bullish move🚀
______________
TARGET: 1.14095🎯

AU Bulls Make A Break For Higher Prices! Time To Long??OANDA:AUDUSD has practically been caught in an Ascending Channel for most of this year but that might not be for "Long"!
A few key things to point out:
- Early April delivered a False Breakout where Price reached the Previous 5 Year Low @ .5980 and was immediately sent back up into the Channel! (Liquidity Sweep??)
- Most of the Price Action that's occurred in this range has been contained to the Upper Chamber of the Channel between the Rising Resistance and Linear Regression.
- Price Consolidated tightly into a Pennant Pattern underneath the Rising Resistance for the past few weeks before delivering a Bullish Break just earlier this evening.
If Bulls are able to sustain Price outside the Channel, this could generate potential Long Opportunities on the Retest of the Break of the Ascending Channel!
Once a Breakout is validated and Retest is successful, the Price Target would be the Next Swing High @ .66875 where Bears were able to push Price down last.
Fundamentally, RBA will be releasing CPI y/y numbers on Tuesday, May 27th with analysts forecasting a .1% Decrease in Inflation from 2.4% to 2.3% after last week having made a 25 basis point rate cut from 4.1% to 3.85%.

FORM/USDT: LONG SCALP SETUP!!🚀 FORM Bull Pennant Breakout – 15% Potential Incoming?! 👀🔥
Hey Traders! If you're all about high-conviction plays and real alpha, smash that 👍 and tap Follow for more setups that actually deliver! 💹💯
FORM is consolidating within a bullish pennant on the 1H chart after a strong 15% impulse move — classic continuation setup.
Price is hugging the triangle resistance and sitting above the 100 EMA, showing strength and reducing downside pressure.
📈 Entry: CMP and add more up to $2.83
🎯 Targets: $3.21 / $3.28 / $3.35
🛑 Stop-Loss: Below $2.78
📊 Risk-Reward: Excellent
💥 Bias: Bullish
📉 Leverage: Use low leverage (max 5x) for safer exposure
Keep your eyes on volume confirmation. A decisive move above the triangle could lead to another explosive leg up.
Agree with the setup? Drop your thoughts below! 👇

Does Gold want to continue Bullish to close out the Month?Looking for more bullish plays but Im thinking we need to allow Monday to play out and wait for the better move on Tues. Be cautious today.

Coiling for a Breakout – Watch This LevelAfter a strong upward move, BYBIT:SUIUSDT is currently consolidating in a sideways range, forming what appears to be a falling wedge pattern — a classic bullish continuation setup.
If this pattern plays out, there's a good chance the price will resume its uptrend, supported by a bullish divergence forming within the wedge. The key level to watch is the resistance at 4.0040. A clean breakout above this level should be backed by strong momentum. However, if the price breaks above but quickly drops back below 4.0040, it could signal a lack of buying pressure — increasing the risk of a failed breakout.
This bullish scenario remains valid as long as the price holds above 3.5868. The next potential upside targets are 4.7996 and 5.0552.
Keep an eye out for a high-volume breakout and a strong candle close above 4.0040 to confirm the move.
What’s your take on BINANCE:SUIUSDT ?

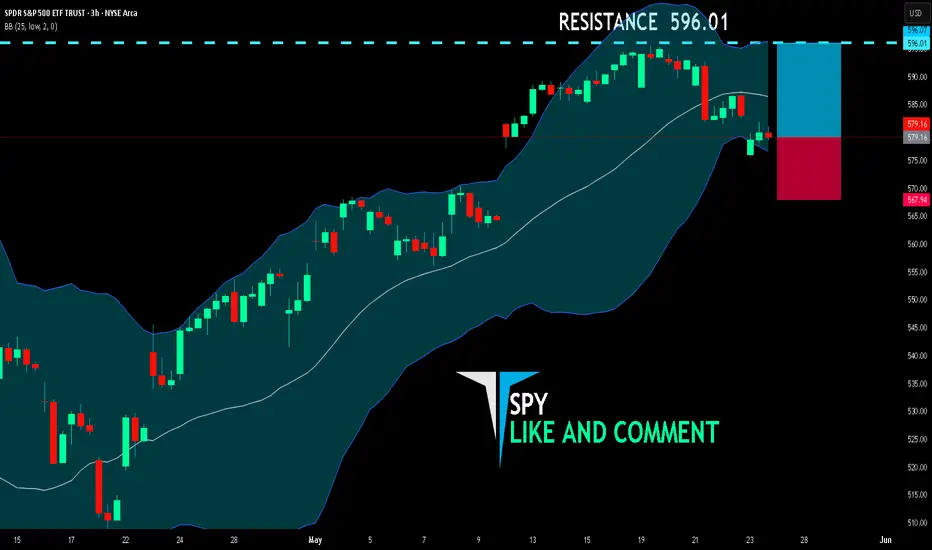
SPY LONG FROM SUPPORT
SPY SIGNAL
Trade Direction: long
Entry Level: 579.16
Target Level: 596.01
Stop Loss: 567.94
RISK PROFILE
Risk level: medium
Suggested risk: 1%
Timeframe: 3h
Disclosure: I am part of Trade Nation's Influencer program and receive a monthly fee for using their TradingView charts in my analysis.
✅LIKE AND COMMENT MY IDEAS✅
Bitcoin - Confirmed Breakout#BTC/USDT #Analysis
Description
---------------------------------------------------------------
+ Bitcoin has successfully broken out from the resistance, this is the third time bitcoin has broken out from the resistance line, in the previous two breakouts bitcoin had significant growth and we can expect similar growth this time.
+ the next target for bitcoin is around 150k and this is an easy target for bitcoin.
+ Bitcoin can see some consolidation around previous resistance (around 109k) but this can be broken easily.
+ Lets see how this plays out.
---------------------------------------------------------------
Enhance, Trade, Grow
---------------------------------------------------------------
Feel free to share your thoughts and insights. Don't forget to like and follow us for more trading ideas and discussions.
Best Regards,
VectorAlgo

ARB - Beautiful Falling Wedge Pattern---------------------------------------------------------------
Description
---------------------------------------------------------------
+ Perfect falling wedge pattern has formed for ARB, a clear breakout from this falling wedge pattern is imminent.
+ breakout from this falling wedge pattern could push the price to previous All time high.
---------------------------------------------------------------
VectorAlgo Trade Details
------------------------------
Entry Price: 0.39
Stop Loss: 0.16
------------------------------
Target 1: 0.6229
Target 2: 0.9196
Target 3: 1.1430
Target 4: 1.6343
Target 5: 2.1129
------------------------------
Timeframe: 1W
Capital: 1-2% of trading capital
Leverage: 5-10x
---------------------------------------------------------------
Enhance, Trade, Grow
---------------------------------------------------------------
Agree or Disagree with the ideas ? lets discuss in the comments.
Like and follow us for more ideas.
Best Regards,
VectorAlgo

ICP - Perfect Long OpportunityDescription
---------------------------------------------------------------
+ ICP has started reversal inside the channel and the price is heading towards the resistance zone, this gives a bullish trade opportunity.
---------------------------------------------------------------
VectorAlgo Trade Details
------------------------------
Entry Price: 5.3
Stop Loss: 3.3
------------------------------
Target 1: 6.9
Target 2: 12.7
Target 3: 22.5
------------------------------
Timeframe: 1W
Capital Risk: 1-2% of trading amount
Leverage: 5-10x
---------------------------------------------------------------
Enhance, Trade, Grow
---------------------------------------------------------------
Feel free to share your thoughts and insights. Don't forget to like and follow us for more trading ideas and discussions.
Best Regards,
VectorAlgo

Its like a Privet Ethereum The tech on this coin is 2nd to monero
Its nothing short of bullish
Privacy coins are underrated

GOLD BULLS WILL DOMINATE THE MARKET|LONG
GOLD SIGNAL
Trade Direction: long
Entry Level: 3,297.95
Target Level: 3,337.98
Stop Loss: 3,271.20
RISK PROFILE
Risk level: medium
Suggested risk: 1%
Timeframe: 1h
Disclosure: I am part of Trade Nation's Influencer program and receive a monthly fee for using their TradingView charts in my analysis.
✅LIKE AND COMMENT MY IDEAS✅

Still bullish above the supportEthereum is still bullish above the support still strong but i can see bullish momentum towards 2700 above 2650 resistance. If it dips back to the support then the bear will be in control so please be cautious and becareful.
If the bullish breaks above 2650 and 2700 then likely will see 3000
Take profit: 2700 short buy
Long take profit: 3000

$BTC to Retest .786 Fib Next ~$102k - BTFD!timberrrrr
the crypto gods shall giveth one last chance.
buy the fckn dip!!!

doge buy midterm"🌟 Welcome to Golden Candle! 🌟
We're a team of 📈 passionate traders 📉 who love sharing our 🔍 technical analysis insights 🔎 with the TradingView community. 🌎
Our goal is to provide 💡 valuable perspectives 💡 on market trends and patterns, but 🚫 please note that our analyses are not intended as buy or sell recommendations. 🚫
Instead, they reflect our own 💭 personal attitudes and thoughts. 💭
Follow along and 📚 learn 📚 from our analyses! 📊💡"

GOLD - BULLISH MOVEHello Traders !
The Gold price formed a symmetrical triangle pattern.
The resistance line is broken !
So, I expect a bullish move🚀
_______________
TARGET: 3414🎯

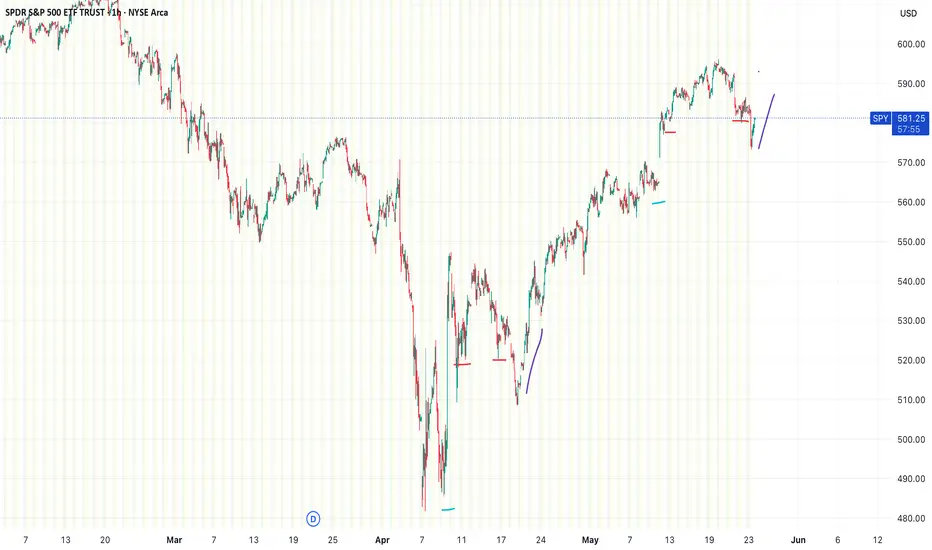
Repeat of Late Apr-May lows & rallyThe chart shows the SPDR S&P 500 ETF Trust (SPY) on a 1-hour timeframe, with a pattern appearing to be repeating itself from late April/May(Liberation day announcements) dip and then boot and rally from trade announcements, all marked by colored lines.
The colored lines (blue, red, purple) highlight a recurring price action setup. Each set of lines seems to mark a sequence of movements:
Blue: Sharp drop, then gap up
Red: Consolidation at a lower higher from gap up, return to high, consolidation back lower at previous lower high
Purple: Breakout & reversal upward.
UNI – Long Spot Trade Setup Following Breakout and RetestUniswap (UNI) has recently broken out of resistance and successfully retested it as support, forming a strong bullish structure. If Ethereum (ETH) continues upward, UNI is likely to benefit from correlated momentum, potentially kicking off a larger rally.
🔹 Entry Zone:
$5.46 – $5.95 (post-breakout retest zone)
🎯 Take Profit Targets:
🥇 $7.50 – $8.00
🥈 $10.00 – $10.50
🛑 Stop Loss:
$4.10

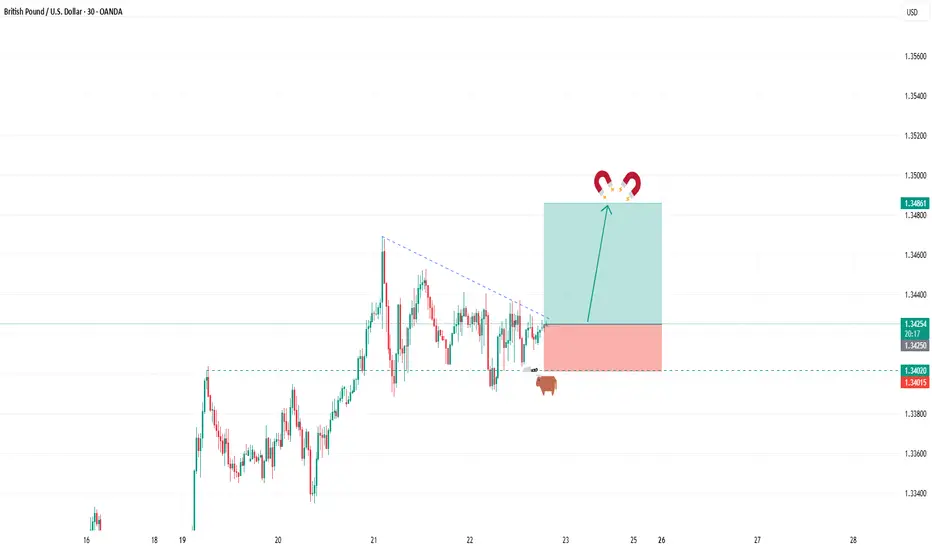
BUY GBPUSDIn todays session we are keenly monitoring CABLE for buying opportunity. Our buy entry is at 1.34258 and our target is at 1.34860 and our tight stop loss is at 1.3400. Use proper risk management. Cheers to you all.