USOIL - Important Breakout !Hello Traders !
The USOIL failed to break the support level (56.047 - 55.102).
Currently, The lower high is broken (Change of Character).
So, I expect a bullish move🚀
________________
TARGET: 63.500🎯
Bullish Patterns

GOLD BULLS ARE GAINING STRENGTH|LONG
GOLD SIGNAL
Trade Direction: long
Entry Level: 3,211.87
Target Level: 3,375.85
Stop Loss: 3,102.01
RISK PROFILE
Risk level: medium
Suggested risk: 1%
Timeframe: 12h
Disclosure: I am part of Trade Nation's Influencer program and receive a monthly fee for using their TradingView charts in my analysis.
✅LIKE AND COMMENT MY IDEAS✅

Bitcoin Chart Pattern Signals Possible Dip Before Pump!🚀 Hey Traders! 👋
If you’re finding value in this analysis, smash that 👍 and hit Follow for high-accuracy trade setups that actually deliver! 💹🔥
📉 #BTC – Potential Inverse Head & Shoulders in Play
Bitcoin is showing signs of a classic inverse head and shoulders formation on the daily chart. However, it's facing heavy resistance near the neckline around the $106,000 zone.
🧠 Possible Scenario:
A correction toward the GETTEX:92K –$93K range could complete the right shoulder before a potential breakout. If we see a clean bounce from that level, bulls might reclaim momentum.
⚠️ Invalidation:
A daily close above $106,000 would invalidate the structure and signal early continuation.
💬 What do you think of this setup? Drop your views and analysis in the comments below!

USDCHF - Important Breakout !Hello Traders !
The USDCHF formed a rectangle pattern.
The price broke the resistance level (0.83350 - 0.82931).
This key level becomes new support !
So, I expect a bullish move🚀
________________
TARGET: 0.85890🎯

12/05/25 Weekly OutlookLast weeks high: $104,972.46
Last weeks low: $93,385.49
Midpoint: $99,178.97
Bitcoin climbs over 12% from weekly low to weekly high, an incredible achievement despite a mixed performance in Tradfi. A pattern we've seen since the $74,500 double bottom following Liberation day goes; A strong rally for a week, consolidation in a tight trading range for a week, then repeat. Should this pattern continue we should see consolidation between weekly high and $102,075 (0.75 line).
CPI & PPI take place this week on Tuesday and Thursday respectively, inflation is still a big talking point but baring a crazy print I would be surprised if these events move BTC. In the last few hours at time of writing The US has reduced tariffs on China to 30% for 90 days, China has reduced tariffs on the US down to 10%. To me this signifies the worst of the trade war narrative is behind us.
This week I will be tracking altcoins with strong fundamentals as BTC.D rolls over from its highest point since January '21, ETH has already had a strong breakout from the downtrend and with BTC at ATH levels with strong resistance this should be the time to see altcoin strength and play catch-up.
Good luck this week!

AUDJPY - Bullish Double BottomHello Traders !
On Tuesday 6 May, The AUDJPY reached the support level (92.222 - 91.978).
The price formed a double bottom pattern.
At the moment, The Neckline is broken !
So, I expect a bullish move🚀
_______________
TARGET: 94.240🎯

Bitcoin Flips $94K Into Support — Bullish Momentum BuildsStructure Strengthens:
Bitcoin's technical structure has improved significantly, with price now holding firmly above the $94,000 level — a former resistance that has flipped into solid support after multiple successful retests.
Bullish Trend Confirmation:
This move reinforces the ongoing bullish trend, driven by a broad bottoming formation from February to April and a clear series of higher lows since March.
Investor Confidence:
The consistent accumulation signals strong buying interest from long-term investors, suggesting that market participants are positioning for further upside.
Outlook & Targets:
As long as Bitcoin maintains levels above $94,000, the bullish outlook remains intact. The next near-term targets lie in the $110,000–$115,000 range.
Bitcoin appears well-positioned for the next leg of its rally. 🚀📈
#Bitcoin #BTC #Crypto #TechnicalAnalysis #BullishTrend #Support #Breakout #MarketUpdate #PriceAction #CryptoMarket

$TOTAL Crypto Market Cap Massive Weekly Close Above 20WMA Massive Weekly Close for the CRYPTOCAP:TOTAL Crypto Market Cap above the .618 Fib and previous cycle's ATH.
RSI still has room to push higher to retest this cycle's ATH.
Price also closed above the 20WMA, which was the signal for the +70% Nov '24 Trump Pump 🚀
UpOnly Season for every coin only happens when the TOTAL Market Cap goes HIGHER.
Otherwise we are stuck in a rotational cycle, where money from one narrative pumps then moves onto the next
ie RWA, DePin, AI, Memes etc

Buy zone opportunityThe Retracement is now complete; pretty short. The bulls showed strength and reversed them dip at 2448 area.
From where its at this should take to 2900 or 3000. Have fun yall

$SOL / $BTC Inverse Head and Shoulders BREAKOUT!!CRYPTOCAP:SOL / CRYPTOCAP:BTC Inverse Head and Shoulders reversal pattern confirmed 🥳
PA has also reclaimed the 50DMA
Bullish Divergence on RSI
So many signs indicators aligning across the market.
IS IT REALLY TIME !!?!?

my idea about btc in secound half of 2025Dear followers,
I’ve analyzed BTC’s recent price movements and on-chain indicators, and I’d like to share my outlook for the second half of 2025. Based on my technical and macroeconomic assessment, I anticipate a significant correction before a strong rebound later in the year.
Key Highlights:
Sell Zone: I expect BTC to reach around $108,000 during a bullish run, where I recommend taking profits and initiating a short position.
Correction Phase: Following the peak, I foresee a correction bringing BTC down to approximately $69,000. This presents a deep buy opportunity for those looking to accumulate at lower levels.
Target for Rebound: Post-correction, I project a strong rally towards $140,000, driven by renewed institutional interest and market fundamentals.
Trading Strategy:
Consider selling or reducing holdings near the $108K level.
Be prepared to accumulate during the dip around $69K.
Aim for the $140K target on the rebound, aligned with overall bullish momentum.
Please note that all trading involves risk, and it's essential to manage your positions carefully. Stay tuned for updates, and always do your own research before making trading decisions.
Let me know your thoughts or if you'd like a deeper analysis!

QNT - The Bulls are Leading!Hello TradingView Family / Fellow Traders. This is Richard, also known as theSignalyst.
📈After breaking above the last major high marked in red, QNT has been overall bullish trading within the rising wedge pattern marked in blue.
Moreover, the green zone is a strong demand and structure.
🏹 Thus, the highlighted blue circle is a strong area to look for buy setups as it is the intersection of structure and lower blue trendline acting non-horizontal support.
📚 As per my trading style:
As #QNT retests the blue circle zone, I will be looking for bullish reversal setups (like a double bottom pattern, trendline break , and so on...)
📚 Always follow your trading plan regarding entry, risk management, and trade management.
Good luck!
All Strategies Are Good; If Managed Properly!
~Rich

DOGE - 1$ NextDoge is getting ready for the next wave. Based on the previous trend we are looking at the next target around 1.1$.
Doge can break 1$ easily based on the current trend and overall interested in DOGE.
Entry: 0.1766
TP1: 0.22086
TP2: 0.30439
TP3: 0.40104
TP4: 0.53436
TP5: 1.13587
Stop Loss: 0.1143
Follow us for more such ideas.
Cheers
GreenCrypto

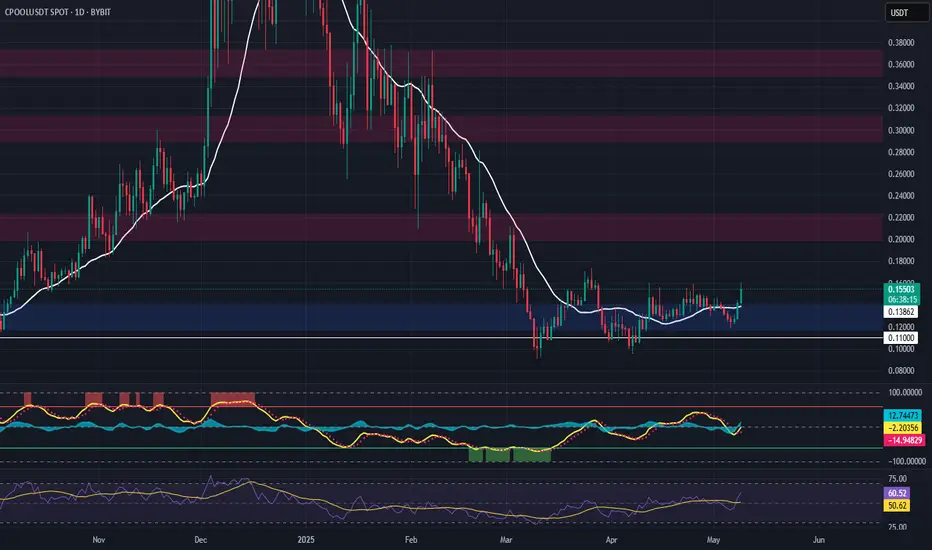
CPOOL (Clearpool) – Momentum Reversal Trade SetupCPOOL is flashing signs of a potential early trend reversal, supported by a strong bounce off a key support zone around $0.140. Price action suggests a reclaim of market structure, positioning this trade for a momentum shift with healthy upside targets.
🔹 Entry Zone:
Around $0.140 (support level)
🎯 Take Profit Targets:
🥇 $0.20 – $0.22
🥈 $0.29 – $0.31
🥉 $0.35 – $0.37
🛑 Stop Loss:
Daily close under $0.11
Thursday 5/8 Oil LONG ENTRY 12pm Thursday Oil Long,
retest of 78.6 Fib retracement level
Early close Friday before Market close
Oil could possibly hold bullish momentum
initial TP: 62,000

GOOGL (Alphabet Inc.) – Medium-Term Position Trade SetupNASDAQ:GOOGL is showing strength as it revisits its previous all-time high, now aligning with the 50% Fibonacci retracement of the current wave. The price action suggests a bullish flip of resistance into support at the $153 zone, with clear signs of buyer defense—offering a compelling medium-term opportunity.
🔹 Entry Zone:
Around $153 (support zone)
🎯 Take Profit Targets:
🥇 $200
🥈 $230
🛑 Stop Loss:
Weekly close below $130

INJ - Long Trade Setup (Medium-Term Reversal Opportunity)INJ (Injective) has completed a deep liquidity sweep and is now reclaiming key technical levels, including the 21-day EMA and a critical horizontal support zone around $11. This sets the stage for a potential medium-term move higher if the structure confirms.
🔹 Entry Zone:
Around $11
🎯 Take Profit Targets:
🥇 $13 – $14
🥈 $17 – $18
🛑 Stop Loss:
Daily close below $8.50

BTC - From Bullish to Extreme Bullish...Hello TradingView Family / Fellow Traders. This is Richard, also known as theSignalyst.
🏢 BTC Building Blocks:
📈 Bullish:
BTC is currently trading within the second floor, between $92,000 and the previous all-time high (ATH) at $109,000.
As BTC retests the $96,000 demand zone, we’ll be looking for trend-following long setups!
📈 Extreme Bullish:
For the momentum to shift from Bullish to Extreme Bullish and enter the price discovery phase, a break above the previous ATH around $109,000 is needed.
📚 Always follow your trading plan regarding entry, risk management, and trade management.
Good luck!
All Strategies Are Good; If Managed Properly!
~Rich

CRYPTO ALT COIN GEM HUNTING!I hope you guys enjoyed the video! Feel free to comment down below other Alt coins that you are buying!

SONIC | (Previously Fantom) | HUGE BULLISH PatternFTM has now officially been replaced on most exchange and is now trading as Sonic.
At first we saw an initial drop, typical "sell the news" actions, but now there is a bullish pattern forming in the 4h timeframe.
SONIC is bullish because:
✅ Upwards trendline trading
✅ Higher Lows
✅ Bullish chart pattern: W-Bottom
_______________
BYBIT:SONICUSDT

TONUSDT Built a Fresh Up Trend!!!Hey Traders, in today's trading session we are monitoring TONUSDT for a buying opportunity around 3.20 zone, TONUSDT is trading in an uptrend and currently is in a correction phase in which it is approaching the trend at 3.20 support and resistance area.
Trade safe, Joe.

PNUT/USDT: FALLING WEDGE BREAKOUT ALERT!!🚀 PNUT Breakout Alert – 100%+ Potential Incoming?! 👀🔥
Hey Traders! If you're all about high-conviction plays and real alpha, smash that 👍 and tap Follow for more setups that actually deliver! 💹💯
PNUT has officially broken out of a falling wedge structure — a bullish reversal pattern we've been eyeing for weeks! After weeks of consolidation and pressure along the wedge resistance, the price has now made a clean breakout with increasing volume.
🔹 Last time it broke out from this zone, we witnessed a massive 109% move.
🔹 Currently, it’s showing a similar breakout structure with room for a big upside move.
🔵 Entry Zone: $0.158–$0.162
🎯 Targets:
• Target 1: $0.21
• Target 2: $0.27
• Target 3: $0.31+
🛑 Stop-loss: $0.142
📊 Leverage: 3x–5x (low to moderate risk)
⚠️ As always, manage your risk and don’t chase pumps. Setup looks strong as long as the breakout holds and we don’t see a fakeout candle back inside the wedge.
📍Let me know what you think — will PNUT fly again?

BITCOIN - Important Breakout (BoS)Hello Traders !
On Monday 5 May, The BTC reached the support level (92800 - 93500).
The price broke the higher high (Break of Structure).
So, I expect a new bullish move🚀
_______________
TARGET: 104000🎯
