XRP Potential Falling Wedge / Bull PennantBINANCE:XRPUSDT is consolidating within a structure that could be interpreted as either a Falling Wedge or a Pennant — both typically bullish in the current context.
Dual Scenario Setup
• Falling Wedge – A classic bullish continuation structure. Breakout target: ~$4.00.*
• Bull Pennant – A high-conviction continuation pattern. Breakout target: ~$5.30.*
* Both targets are measured from the presumed breakout point and are only valid if price breaks out in the near term.
Key Technical Levels
• Resistance: ~$2.40 – The descending trendline capping price since January.
• Support: ~$1.60 – Confluence of support support trendline + 0.618 Fib retracement of the rally + 1-Year EMA.
• Supply Zone: ~$3.40
• A break below ~$1.60 would invalidate both patterns and shift bias to bearish.
Volume Note: Gradual decline during consolidation supports both wedge and pennant interpretations. A spike in volume post-breakout would confirm strength.
Until a confirmed breakout above ~$2.40 resistance, this remains in a No-Trade Zone for me — but one worth watching closely.
Bullish Patterns

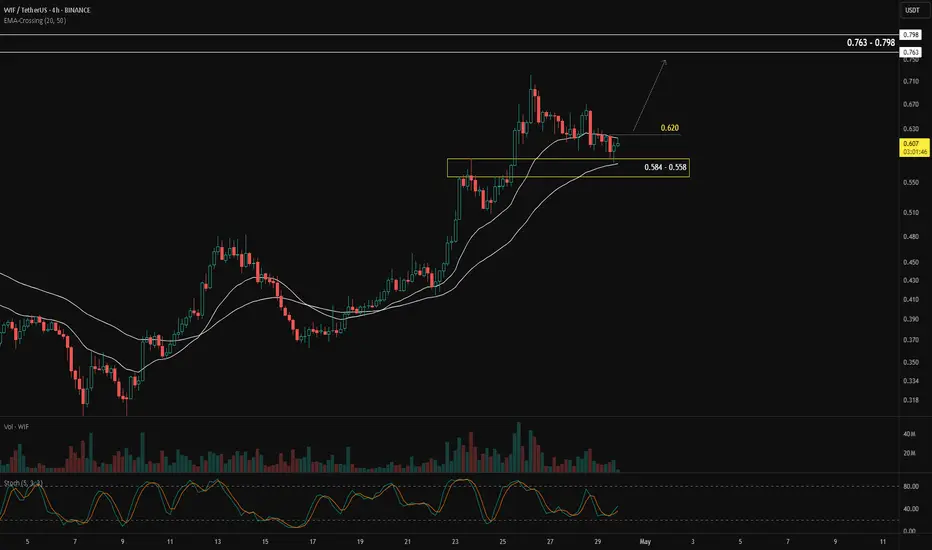
When Moving Averages Meet the Demand ZoneOne of the simplest ways to identify the market trend is by using the moving average (MA) indicator.
When price moves above the MA, it's generally considered an uptrend.
When price moves below the MA, it's seen as a downtrend.
Aside from showing the trend, moving averages can also act as dynamic support and resistance:
In an uptrend, the MA acts as support — meaning if price retraces into the MA, it often bounces back and continues upward.
In a downtrend, the MA acts as resistance — price tends to reject the MA and move lower.
In BINANCE:WIFUSDT , the moving average is currently acting as support, and price is pulling back into a confluence zone between 0.584 – 0.558, where the MA meets a demand zone. This setup increases the probability of the pullback ending and the uptrend continuing.
The confirmation for a bullish continuation would be a break and close above 0.620.
If that happens, the next target zone is between 0.763 – 0.789.
Keep a close eye when price approaches the previous high. The ideal scenario is a strong impulsive breakout. The worst-case scenario would be a rejection or false breakout from that level.
Alright, what's your take on BINANCE:WIFUSDT ?
SOL Trade Setup – Structure Shift & Higher Low FormationSolana (SOL) has shown significant strength after deviating below range lows and tagging $95, quickly recovering and reclaiming key support, indicating a bullish structural shift. We’re now watching for a retrace into the $120 zone, which could confirm a higher low and set up a strong medium-term long entry.
🔹 Entry Zone:
Around $120
🎯 Take Profit Targets:
🥇 $162
🥈 $187
🥉 $213
🛑 Stop Loss:
Daily close below $110

XAUUSDIs XAUUSD building for massive breakout?
If XAUUSD sustains 3300 level then it can target 3400 in no time.

Bullish Pennant in ARDR: A Pause Before Another RallyAfter an aggressive surge marked by a big green candle, BINANCE:ARDRUSDT is now moving sideways. This sideways action represents a "voting phase" between buyers and sellers — a battle to decide who will take control next.
Looking at the current price structure, this consolidation is setting up a potential continuation move toward the next target zone at 0.15199 – 0.15900.
Technically, the sideways movement is forming a bullish pennant pattern — a classic sign where price briefly pauses after a strong rally, gathering momentum before continuing its upward trend.
One thing to watch: after breaking the previous high (marked by the red arrow), price should not fall back into the pennant structure. A re-entry would weaken the bullish setup.
As long as price holds above the key support at 0.12273, the bullish scenario remains intact.
What's your view on this setup?

Is EURUSD getting ready for another 600 pips bull run?🏆 EURUSD Market Update
📊 Technical Outlook
🔸Short-term: mixed/range
🔸Mid-term: BULLS 2000
🔸Status: accumulation in range
🔸previously x2 waves +600 pips
🔸clearly strong uptrend in progress
🔸Price Target Bears: range
🔸Price Target BULLS: 2000
🔸strategy: accumulate in range
🔸TP1 +200 TP2 +400 pips
🔸SL 60 pips / below accum range
📈 EUR/USD Bullish Drivers
🏦 ECB staying cautious on rate cuts while Fed signals easing
📉 Weak U.S. job and manufacturing data pressuring the dollar
🌍 U.S. trade policy uncertainty pushing investors toward euro
📊 Technicals show strong support, RSI confirms bullish momentum
🔮 Outlook
⏳ Short-term: Targeting 1.1500 if U.S. data stays soft
📆 Medium-term: 1.20 possible on policy divergence and EU fiscal boost

EUR/GBP LONG FROM SUPPORT
Hello, Friends!
We are now examining the EUR/GBP pair and we can see that the pair is going down locally while also being in a downtrend on the 1W TF. But there is also a powerful signal from the BB lower band being nearby indicating that the pair is oversold so we can go long from the support line below and a target at 0.860 level.
Disclosure: I am part of Trade Nation's Influencer program and receive a monthly fee for using their TradingView charts in my analysis.
✅LIKE AND COMMENT MY IDEAS✅

GOLD BULLS WILL DOMINATE THE MARKET|LONG
GOLD SIGNAL
Trade Direction: long
Entry Level: 3,281.65
Target Level: 3,346.60
Stop Loss: 3,238.35
RISK PROFILE
Risk level: medium
Suggested risk: 1%
Timeframe: 2h
Disclosure: I am part of Trade Nation's Influencer program and receive a monthly fee for using their TradingView charts in my analysis.
✅LIKE AND COMMENT MY IDEAS✅

GBPNZD - Marco Trend Still Up!Hello TradingView Family / Fellow Traders. This is Richard, also known as theSignalyst.
📈GBPNZD has been overall bullish from a macro perspective trading within the rising channels in blue and orange.
Moreover, the green zone is a strong support, structure and demand.
🏹 Thus, the highlighted blue circle is a strong area to look for buy setups as it is the intersection of support and lower orange/blue trendlines acting non-horizontal support.
📚 As per my trading style:
As #GBPNZD approaches the blue circle zone, I will be looking for bullish reversal setups (like a double bottom pattern, trendline break , and so on...)
📚 Always follow your trading plan regarding entry, risk management, and trade management.
Good luck!
All Strategies Are Good; If Managed Properly!
~Rich
Disclosure: I am part of Trade Nation's Influencer program and receive a monthly fee for using their TradingView charts in my analysis.

The Monthly Transition for GoldLooking for price to retrace and take out lows before it proceeds to be bullish. Waiting for Killzones.

$BTC Rejected at .618 Fib - Correction Coming!Textbook rejection at the .618 Fib for CRYPTOCAP:BTC
Now on its way to retest the 200 and 50DMA as expected.
If that does not hold, we’ll go back to my original inverse head & shoulder idea ~$78k.
This will be the catalyst for Bitcoin’s next leg up to $130k end of June.

EURCHF - NEW BREAKOUT !Hello Traders !
On Wednesday 9 April, The EURCHF reached a strong support level.
The price broke the resistance (0.94090 - 0.93900).
This key level becomes new support !
So, I expect a bullish move🚀
______________
TARGET: 0.94830🎯

GBPCAD - BULLISH MOVEHello Traders !
The GBPCAD broke the resistance level (1.83706 - 1.84150).
This key level becomes new support!
So, I expect a bullish move🚀
Let's wait for a retest...
____________
TARGET: 1.85720🎯

BTC Breaks Out Above Key Resistance Bullish Momentum AcceleratesClassic Technical Breakout:
Bitcoin has surged past the critical $91,607 resistance level, which had capped its upside since February. This breakout marks a major shift in market momentum.
Broader Bullish Structure:
The move confirms a larger bullish structure, defined by a consistent pattern of higher lows and higher highs since the March lows, signaling strong market health.
Accumulation Zone Cleared:
Bitcoin’s breakout from the well-established $76,000–$92,000 accumulation zone further strengthens the bullish outlook, highlighting robust underlying demand.
Road to Six Figures:
Now trading above key psychological and technical levels, Bitcoin appears poised for a potential move toward six figures and a retest of all-time highs above $108,000 — as long as it holds above the breakout zone.
Conclusion:
Momentum is clearly favoring the bulls. Bitcoin’s breakout could mark the beginning of its next major rally phase. 🚀📈
#Bitcoin #BTC #Crypto #Breakout #TechnicalAnalysis #Bullish #Resistance #CryptoMarket #MarketUpdate

Coinbase Global (COIN) – Bridging Crypto and Traditional FinanceCompany Snapshot:
Coinbase NASDAQ:COIN is cementing its role as the gateway to the crypto economy, offering secure trading, custody, and institutional-grade financial services—positioning itself for expansion well beyond retail.
Key Catalysts:
Bank Charter Ambitions 🏦
Exploring a bank charter, potentially evolving into a full-service financial institution
Would diversify revenue and boost regulatory credibility, key in the maturing crypto sector
Institutional Growth Momentum 📈
Extending credit to major players like CleanSpark
Building sticky, high-value relationships and reducing retail dependency
Strengthening Financials 💰
14.8% pre-tax margin
39.16% profit contribution margin → Clear operating leverage and path to sustainable, scalable profitability
Trusted Brand Advantage 🛡️
Strong institutional trust + regulatory compliance reputation → defensible moat in a volatile industry
Investment Outlook:
✅ Bullish Above: $160.00–$162.00
🚀 Target Range: $280.00–$290.00
🔑 Thesis: Regulatory expansion + institutional scale-up + financial efficiency = long-term crypto-finance powerhouse
📢 COIN: Not just a crypto exchange—an evolving financial institution for the digital future.
#CryptoFinance #Coinbase #DigitalAssets #Fintech #InstitutionalGrowth #BankingFuture

BTC Potential Breakout, Daily DivergenceBTC on the daily has the opportunity to expand way upwards over the next month - a divergence on the daily evidently takes longer to play out but RSI could easily reach 80 off the back of the structure.
I have been shorting, confidently, for a good few weeks now, with longs in between, but I'm starting to feel like I should flip long.
Solana is also trying to reclaim the daily/weekly range - things to think about for sure.
Good luck out there!

Two Bullish Scenarios to Watch on ETHUSDTThis week, BINANCE:ETHUSDT has shown a significant upward movement, and there's a good chance it could continue its bullish momentum.
There are two bullish scenarios developing on BINANCE:ETHUSDT :
1. After a pullback, we could see an impulsive move that breaks the previous high (marked with the red arrow) and pushes the price towards the first target at 1,911 – 1,957.
2. The price could move sideways for a while, forming a bullish pennant pattern. In this case, a correction towards 1,756 – 1,731 might occur before the price resumes its move to the first target at 1,911 – 1,957.
Both scenarios remain valid as long as the price holds above 1,722.
If the second scenario plays out, the pullback to 1,756 – 1,731 can be considered a good buy zone (for those who are not in position yet).
Remember: wait for a confirmation candle before entering and place your stop-loss just below the confirmation candle.

DXY Printing a Bullish Triangle??The DXY on the 1 Hr Chart is forming a potential continuation pattern, the Bullish Triangle!
Currently Price is testing the 99.6 - 99.8 Resistance Area and battling with the 200 EMA and 34 EMA Band. The reaction to this conjunction could be pivotal in who overcomes: Buyers or Sellers.
Now during the formation of the potential pattern, Price on the RSI has stayed relatively Above the 50 mark being Bullish Territory suggesting Buyers could win the Bull-Bear battle.
Until Price breaks either the Resistance Area or the Rising Support, we will not have a definitive direction in which USD will strengthen or weaken.
*Wait For The Break*
-If Price breaks the Resistance Area, USD will strength possibly heading to the 100.8 - 101 Area
-If Price breaks the Rising Support, USD will weaken possibly heading to the 98.5 - 98.3 Area
Fundamentally, it is said China and USA are possibly getting closer to potentially ending the Reciprocal Tariff War going on with both sides willing to negotiate.
With the USA being the #1 Consumer of Goods globally, other economies can not afford us to not buy their things so I continue to see the Tariff War more as a Strong-Arm for the USA to be able to negotiate better terms!
USD News:
JOLTS - Tuesday, Apr. 29th
GDP - Wednesday, Apr. 30th
Unemployment Claims / ISM Manu. PMI - Thursday, May 1st
Non-Farm Employment Change / Avg Hourly Earnings / Unemployment Rate - Friday, May 2nd
For all things Currency,
Keep it Current,
With Novi_Fibonacci

TAO ANALYSIS📊 #TAOAnalysis
✅There is a formation of Descending Channel Pattern in daily time frame in #TAO .
Also there is a perfect breakout and retest. Now we can expect a bullish move. If the price sustains the major resistance zone then we will see more bullish move
👀Current Price: $349
🎯 Target Price : $460
⚡️What to do ?
👀Keep an eye on #TAO price action and volume. We can trade according to the chart and make some profits⚡️⚡️
#TAO #Cryptocurrency #Breakout #TechnicalAnalysis #DYOR

DOUBLE BOTTOM PATTERN 🚨 DRIFT Forming Bullish Double Bottom Pattern 🚨
DRIFT is forming a bullish double bottom pattern and is approaching a key red resistance zone. A breakout above this level could signal a strong bullish move.
📈 Technical Overview:
Pattern: Bullish Double Bottom
Resistance Zone: Red area currently being tested.

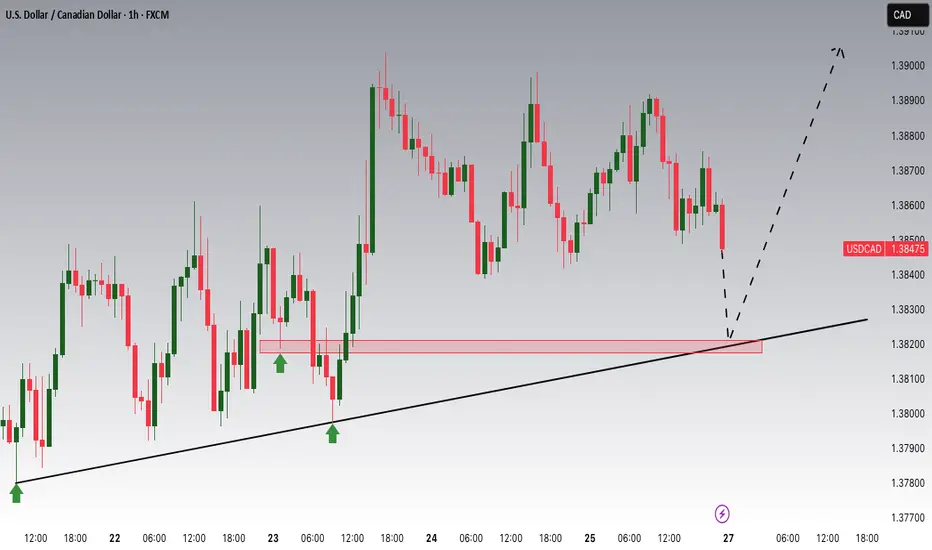
USDCAD Potential UpsidesHey Traders, in today's trading session we are monitoring USDCAD for a buying opportunity around 1.38200 zone, USDCAD is trading in an uptrend and currently is in a correction phase in which it is approaching the trend at 1.38200 support and resistance area.
Trade safe, Joe.
USDJPY: Bulls Eye Key Support as Trade Optimism Lifts DollarHey Traders, We are currently monitoring USDJPY for a potential buying opportunity as price approaches the 143.200 level, an important area that has acted as both support and resistance in recent sessions. Technically, the pair remains in a well-defined uptrend, and this pullback appears to be part of a healthy correction phase rather than a trend reversal. The 143.200 zone also aligns with a dynamic trendline support, increasing the likelihood of a bullish reaction if price holds above this level. From a fundamental perspective, recent developments have started to tilt in favor of the dollar. News of progress toward a trade agreement between the U.S. and India has sparked optimism, as it may lay the groundwork for similar deals with other key global partners. This has been compounded by unconfirmed reports out of China suggesting potential tariff exemptions in specific sectors, which has further boosted investor sentiment and triggered a broader “risk-on” shift in markets. As geopolitical tensions around trade show signs of easing, the U.S. dollar is regaining strength, fueling the case for further upside in USDJPY. Taken together, the convergence of technical support and improving macroeconomic signals presents a compelling opportunity for bulls, provided we see signs of price stability or a confirmed bounce near the 143.200 area.
Trade safe, Joe.

Crucial Level to Watch on BTC.DWe can see that CRYPTOCAP:BTC.D is still in a bullish trend and is currently testing a crucial level, which will determine whether it continues to make a higher high or starts weakening towards its previous low.
The influence of CRYPTOCAP:BTC.D on the crypto market is simple: if CRYPTOCAP:BTC.D moves higher, it means more money is flowing into Bitcoin. For example, if CRYPTOCAP:BTC.D is at 64%, it means 64% of the total crypto market capitalization is in Bitcoin, and the remaining 36% is spread across altcoins like CRYPTOCAP:ETH , CRYPTOCAP:SOL , CRYPTOCAP:DOGE , CRYPTOCAP:PEPE , etc.
Conversely, if CRYPTOCAP:BTC.D moves lower, it means more money is shifting into altcoins.
Strategy when CRYPTOCAP:BTC.D is rising:
You can allocate more into Bitcoin rather than altcoins. Alternatively, you can find altcoins that are outperforming Bitcoin.
How to find altcoins that outperform Bitcoin?
Look for altcoin/BTC pairs, for example: BINANCE:WIFBTC , BINANCE:NEARBTC , or $BINANCE:TAOBTC.
If the price of BINANCE:WIFBTC is going up, it means SEED_WANDERIN_JIMZIP900:WIF is gaining more value compared to $BTC. If it's going down, it means Bitcoin is performing better than $WIF.
Back to CRYPTOCAP:BTC.D :
Currently, CRYPTOCAP:BTC.D is testing the 64.19% – 64.10% zone.
This area will determine whether CRYPTOCAP:BTC.D continues upward or starts to weaken.
To get early confirmation, you can zoom into the 1-hour chart and look for signs of bullish divergence.
If bullish divergence appears on the 1-hour chart, it often leads to a bounce on the 4-hour chart and a potential continuation of the bullish trend, possibly breaking the previous high.
However, if there's no bullish divergence confirmation, or if there's a strong rejection at the support level, CRYPTOCAP:BTC.D is likely to weaken and move towards its previous low.
