BTC - Bulls Charging... However!Hello TradingView Family / Fellow Traders. This is Richard, also known as theSignalyst.
As per our last analysis (attached on the chart), BTC rejected the blue trendline support and has been bullish in the medium term. 📈
However, the overall sentiment remains bearish, as BTC is still trading within the falling channel marked in red. 📉
For the bulls to take over long term and initiate the next impulsive wave, a break above the $91,000 major high in blue is needed. 🔵
Meanwhile, BTC may still retest the blue trendline — where we’ll be looking for new short-term longs. 🎯
📚 Always follow your trading plan regarding entry, risk management, and trade management.
Good luck!
All Strategies Are Good; If Managed Properly!
~Rich
Bullish Patterns

AI Sector Watch – TAO Pullback OpportunityAI-related tokens are showing real strength lately, and TAO has led the charge with a series of green candles. However, the most recent candle suggests potential for a cool-off into support—which could form a higher low and provide a great entry opportunity.
📍 Entry Zone:
$279 (potential higher low formation)
🎯 Take Profit Targets:
🥇 $292
🥈 $317
🛑 Stop Loss:
Below $260 (look for daily close confirmation)
📊 Notes:
If price consolidates above $279 and bounces, it confirms strength.
Watch for volume drop during the pullback—bulls want a light retrace before resuming higher.
If TAO breaks and holds above $292 quickly, you may want to trail your stop.

ONDO/USDT: FALLING WEDGE BREAKOUT!🚀 ONDO Breakout Alert – 80%+ Potential Incoming?! 👀🔥
Hey Traders! If you're all about high-conviction plays and real alpha, smash that 👍 and tap Follow for more setups that actually deliver! 💹💯
ONDO has officially broken out of a long-term falling wedge, a classic bullish reversal pattern. After months of compression and lower highs, price has finally pushed above the resistance line — signaling a potential trend reversal is in play. 📊
🔹 Entry: CMP (~$0.87)
🔹 Targets: $1.20 / $1.42 / $1.63
🔹 Stop-loss: $0.772
🔹 RR Ratio: Excellent risk-to-reward setup
🔹 Leverage: Use low to moderate (Max 5x)
🧠 Trade Idea:
With volume slowly picking up and structure breakout confirmed, this setup could offer big upside potential. Spot entries also look attractive for mid-term accumulation.
💬 Drop your thoughts or charts below — let’s ride this one smart and together! 🚀

21/04/25 Weekly OutlookLast weeks high: $86,492.19
Last weeks low: $83,112.72
Midpoint: $84,802.45
Is the market finally showing its hand?
After President Trumps escalation of the tariff trade war, BTC saw huge volatility swings in line with Tradfi, the panic led to de-risking and as a result BTC hit $74,500. Then after a small bounce another revisit of the exact same area resulted in a much more substantial reversal back up into the $80K's. A double bottom and rally despite the tariff situation ongoing suggests huge support/strength in that area on the HTF, I am now satisfied that BTC has closed the area of imbalance caused by the US election pump, confirming support. This event also coincided with SPX bouncing off the 1D 200 EMA.
Since then Bitcoin has rallied back to the upper limit of the downtrend channel (see my previous posts on this structure) which also has the 4H & 1D 200 EMA placed there. For a bullrun to sustain itself these moving averages are important to maintain momentum, time spent under these MA's kill the bullish trend and weaken sentiment around the move.
Last week we saw a very tight trading range of only 4%, that is compared to 15.4% the week previous. My theory was that this compression of price around a key area (4H & 1D 200 EMA + trend channel high) leads to a much bigger impulse move, the only question was in which direction?
The minute the weekly bar closed BTC exploded above both of these MA's and out of the downtrend, so it looks like the question is answered when it comes to direction of the impulse move. The next question is, will it stick?
I do find the timing of the move somewhat suspicious as the majority of Europe are on a public holiday, could this be a MM taking advantage of thin order books? the SPX pre-market is fairly neutral and so I believe tomorrow will tell the true story of where BTC really is.

GBPUSD - NEW BREAKOUT !Hello Traders !
The GBPUSD failed to create a new lower low!
At the moment, The last higher high is broken (break of structure).
So, I expect a bullish move🚀
______________
TARGET: 1.33630🎯

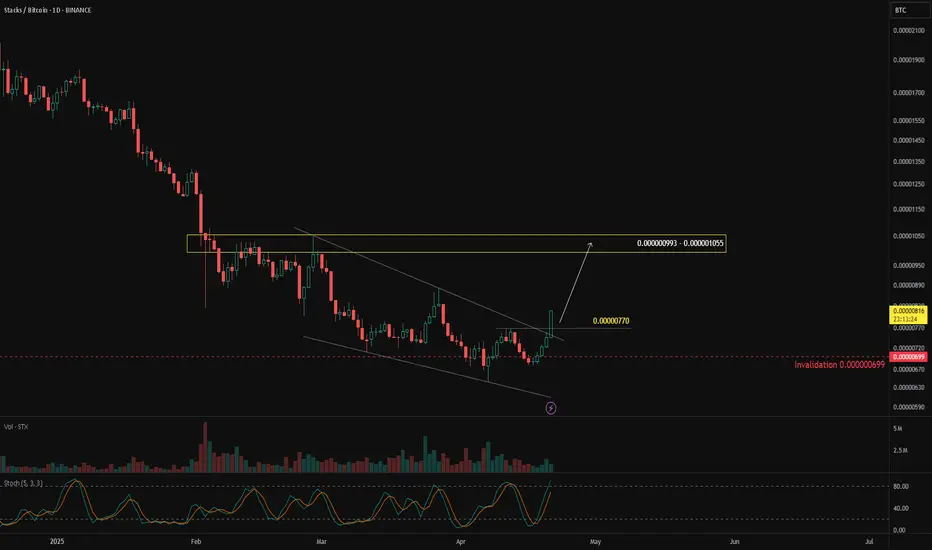
Will STX Outperform Bitcoin?In the crypto market, if you want to beat the market, your benchmark is $CRYPTO:BTCUSD. That means to outperform the crypto market, you need to outperform Bitcoin.
One way to measure this is by watching crypto/BTC pairs, such as $BINANCE:STXBTC. If $BINANCE:STXBTCgoes up, it means STX is stronger than BTC. If it goes down, BTC is stronger than STX.
On the daily chart, BINANCE:STXBTC has been moving downward, but over the past month, sellers seem to be losing momentum—indicated by a falling wedge reversal pattern.
A bullish breakout above 0.000000770 would confirm the pattern, with a potential upside target at 0.000000993 – 0.000001055. This scenario remains valid as long as price holds above 0.000000699.
BTC - Halving Cycle | Historical Patterns & 2025-2026 Projection
In this chart, we dive deep into the cyclical nature of Bitcoin price action post-halving and draw parallels between past and current movements, with a specific focus on how the market has historically reacted at various intervals following each halving event. This analysis incorporates both structural and temporal elements, providing a potential roadmap based on previous behavior.
---
Historical Context: Previous Cycles
3rd Halving – May 11, 2020
Following the 3rd Bitcoin halving, we observed a parabolic run-up over the next several months:
- 11 months after halving (April 2021): BTC reached a major peak, hitting nearly $65,000.
- This was followed by a significant correction.
- 19 months after halving (December 2021): Bitcoin printed a second top close to the previous all-time high, forming a classic double top pattern. This structure often signals market exhaustion and precedes deeper corrections.
Cycle Completion – Price Reversion
By 30 months after the 3rd halving (around November 2022), BTC had retraced much of its gains and returned to prices nearly equivalent to the halving level (~$8,000–$10,000 zone in log-adjusted terms). This marked the end of the cycle, confirming a full reversion to the mean after the double-top distribution phase.
---
Current Cycle: 4th Halving – April 19, 2024
We're now entering the 4th post-halving cycle , and so far, the structure appears to be rhyming closely with the previous cycle :
- Pre-halving rally took BTC to ~ FWB:73K (March 2024), indicating strong bullish momentum leading into the event.
- If this cycle follows a similar path, we may expect:
- A first major top around 9 months after the halving , potentially at or above $100K.
- A second top forming around 17 months after the halving (projected for September 2025), possibly signaling the beginning of a broader correction phase.
---
Projection: October 2026 (30 Months After Halving)
Using the same temporal framework:
- By October 2026 (30 months post-halving), the chart suggests a return to a much lower level , possibly around $50K.
- This projection mimics the post-double-top decline of the previous cycle, reinforcing the idea of cyclical mean reversion .
- It’s important to note: this isn’t necessarily bearish, but it highlights the cyclical and psychological nature of markets —boom, euphoria, distribution, and reversion.
---
The Macro View: Halving Cycles Are Rhythmic
- Every halving has historically set off a new bull run, but the timing of tops and bottoms is shockingly consistent :
- Peaks often occur 9–18 months post-halving .
- Full cycle completion is around 30 months post-halving.
- These cycles are heavily influenced by supply shocks , market psychology , and macro liquidity cycles .
---
Final Thoughts
This chart isn’t a guarantee—it’s a probability model based on cyclical symmetry. If history repeats or rhymes, we may be witnessing another textbook cycle play out, where a euphoric run in 2025 gives way to a deep correction by late 2026.
Stay alert for the double top pattern and macro divergences. Just as in 2021, timing the exit after the first peak can be the difference between profit and pain .
What do you think? Will Bitcoin follow the same 30-month post-halving trajectory?

XRP on the go!Hello TradingView Family / Fellow Traders. This is Richard, also known as theSignalyst.
📈 Medium-Term: XRP has been in a correction phase trading within the falling wedge marked in red.
📍 As it retests the lower bound of the channel — which perfectly intersects with the orange demand zone and the $1.5 round number — I’ll be looking for short-term longs.
🚀 For the bulls to take over in the long term and kick off the next bullish phase, a breakout above the red structure at $2.26 is needed.
Which scenario do you think will happen first — and why?
📚 Always follow your trading plan regarding entry, risk management, and trade management.
Good luck!
All Strategies Are Good; If Managed Properly!
~Rich

Golden Cross means Golden Opportunity?Here's What You Need to Know About Moving Averages
One of the signs of the beginning of a bullish trend is the golden cross — a crossover between two moving averages. The shorter-period moving average (closer to the price) crosses above the longer-period moving average (farther from the price).
When this happens, it could be a signal to consider buying or opening a long position, especially if supported by candlestick confirmation. The target is usually set higher than the previous high.
Case Study: BINANCE:STEEMUSDT
The price began trading above the EMA 20 (white line) and EMA 50 (pink line), then the EMA 20 crossed above the EMA 50 — forming a golden cross.
But instead of entering immediately, you should wait for a price retracement back to the EMAs, allowing them to act as support (also known as dynamic support, since EMAs move with price).
In this case, a bullish engulfing candlestick pattern appeared right at the EMAs. The confirmation level is at 0.1303, which means the price needs to close above this level to validate the bounce from the EMAs. The invalidation level is below the bullish engulfing candle — at 0.1270.
Target prices:
Target I: 0.1570 – 0.1632
Target II: 0.1802 – 0.1887
You might be wondering: How do I choose which target to aim for?
Let me explain — the main target is 0.1802 – 0.1887 because it’s above the previous high (in a bullish trend, price tends to form higher highs).
Then why include 0.1570 – 0.1632? Even though we aim for the higher target, we still need to be cautious of potential resistance in that zone. Once the price hits that level, observe how it reacts.
If there’s a significant rejection or price drop, consider reducing your position to secure profits. But if the price keeps pushing up with strong momentum, let the profits run.
So in this case, 0.1570 – 0.1632 acts more like a level of awareness rather than a fixed take-profit target.
Let me know what you think about this post!
Would love to hear your thoughts and how I can support your trading journey with more technical insights or educational content like this. 🙌

Ripple Breakout and Potential RetraceHey Traders, in today's trading session we are monitoring Ripple for a buying opportunity around 1.9800 zone, XRP was trading in a downtrend and successfully managed to break it out. Currently is in a correction phase in which it is approaching the retrace area at 1.98000 support and resistance area.
Trade safe, Joe.

Avalanche Potential UpsidesHey Traders, in today's trading session we are monitoring Avalanche for a buying opportunity around 19.20 zone, Avalanche is trading in an uptrend and currently is in a correction phase in which it is approaching the trend at 19.20 support and resistance area.
Trade safe, Joe.

NG1! BUYERS WILL DOMINATE THE MARKET|LONG
NG1! SIGNAL
Trade Direction: long
Entry Level: 3.247
Target Level: 3.717
Stop Loss: 2.932
RISK PROFILE
Risk level: medium
Suggested risk: 1%
Timeframe: 1D
Disclosure: I am part of Trade Nation's Influencer program and receive a monthly fee for using their TradingView charts in my analysis.
✅LIKE AND COMMENT MY IDEAS✅

AUD/CHF BULLISH BIAS RIGHT NOW| LONG
Hello, Friends!
Bullish trend on AUD/CHF, defined by the green colour of the last week candle combined with the fact the pair is oversold based on the BB lower band proximity, makes me expect a bullish rebound from the support line below and a retest of the local target above at 0.522.
Disclosure: I am part of Trade Nation's Influencer program and receive a monthly fee for using their TradingView charts in my analysis.
✅LIKE AND COMMENT MY IDEAS✅

I'm Bullish, but... CHR / USDTEvening fellas,
My latest posts are bullish, and I did long some coins during the blood we had a couple of days ago.
But one must always be ready and I am seeing something interesting in a couple of coins, showing me that there's a hidden bearish scenario behind all the hype.
CHR is one of those coins, it's got good news, hype, etc, but I think MM'rs want to destroy some lives.
Keep an eye on it.
Trade thirsty, my friends!

People Used To Get Scared - BTC / USDMorning folks,
Read the chart, it contains all information.
I figured since I didn't update my inverted Adam & Even pattern chart much I'd just create a new one, but check it out, its playing marvelously.
Trade thirsty!

Conspicuous - MANA / USDTEvening fellow traders,
Every now and then I ride waves on MANA.
This time it won't be different, as I am already in it.
But I'm looking for an extra touch, that outta the box type thing and buying an extra chunk between the prices shown in the chart.
Please take advantage of this if you get the chance, and let's make a big chunk of money together!
Trade thirsty, my friends!

Bullish Triangle Pattern on ProgressIn my previous update on BINANCE:CRVUSDT , I mentioned three potential scenarios: a bullish triangle formation, sideways movement, and a double top pattern.
Right now, it looks like the bullish triangle pattern is playing out. If this continues, I expect the price to reach the 0.7853 – 0.8343 target zone. But before that, all eyes are on the key resistance at 0.6667 — the prior high.
The best-case scenario would be a strong breakout above 0.6667, ideally with a solid bullish candle showing strong buyer momentum.
However, stay cautious. If price breaks the resistance but quickly falls back into the triangle and breaks the low of the breakout candle, that could be a false breakout (or what some might call a liquidation sweep). In that case, reducing exposure could be a wise move, as price might enter a sideways phase.
On the other hand, if price gets rejected (before breakout) at 0.6667 with a large red candle, that’s still acceptable — as long as price holds above the invalidation level at 0.5781.
Let’s keep watching how price reacts around key levels. Market structure still favors the bulls, but risk management is key.

AUD/NZD LONG FROM SUPPORT
Hello, Friends!
AUD/NZD pair is in the downtrend because previous week’s candle is red, while the price is clearly falling on the 6H timeframe. And after the retest of the support line below I believe we will see a move up towards the target above at 1.083 because the pair oversold due to its proximity to the lower BB band and a bullish correction is likely.
Disclosure: I am part of Trade Nation's Influencer program and receive a monthly fee for using their TradingView charts in my analysis.
✅LIKE AND COMMENT MY IDEAS✅

Wyndham Hotels (WH). Big Bullish Insider Moves? My Pick.WYNDHAM HOTELS & RESORTS (WH) Headquartered in NJ, USA who owns La Quinta, Days Inn, Ramada, Super 8, and other well known hotels and resorts.
With April Break approaching in a post Covid lockdown environment, we may see Wyndham revenue higher in coming months. Further more (as according to Robinhood) in March of 2025, Insiders purchased roughly 375k shares , but price continued to descend. Insider selling was only reported at 122k shares. Could this indicate bullish internal sentiment?
There appears to be an bullish RSI divergence forming on the 1 Day chart . DMI bearish momentum is declining currently as well as the ADX.
Overall my hypothesis is bullish, and my current opinion on a price target for Wyndham Hotels & Resorts is $108 given various factors.

CHF/JPY BUYERS WILL DOMINATE THE MARKET|LONG
Hello, Friends!
We are targeting the 175.525 level area with our long trade on CHF/JPY which is based on the fact that the pair is oversold on the BB band scale and is also approaching a support line below thus going us a good entry option.
Disclosure: I am part of Trade Nation's Influencer program and receive a monthly fee for using their TradingView charts in my analysis.
✅LIKE AND COMMENT MY IDEAS✅

BTC / Bitcoin / BTCUSDT Bullish OutlookDaily Time Frame Analysis: Bitcoin (BTC) has recently broken out of a descending trendline on the daily chart, signaling a potential shift in momentum. Following the breakout, BTC has entered a consolidation phase, lasting for the past 7–8 days.
Short-Term Outlook: In the near term, BTC may either:
Break out to the upside from the current consolidation zone, or
Execute a fake-out to the downside before reversing sharply.
Potential Upside Targets:
Target 1: $87,000
Target 2: $88,000
Target 3: $90,000
Target 4: $92,000
Traders should monitor price action closely for confirmation before entering positions.

ETH - Log long Chart!Hello TradingView Family / Fellow Traders. This is Richard, also known as theSignalyst.
Let’s keep it simple! ⚡
📈 ETH is approaching a major structure and potential rejection zone marked in blue.
As long as this key support holds, the long-term bullish bias remains intact.
It’s only a matter of time before the bulls step in — confirmation will come from lower timeframes. 👀
📚 Always follow your trading plan regarding entry, risk management, and trade management.
Good luck!
All Strategies Are Good; If Managed Properly!
~Rich

LINK Potential Falling Channel Reversal + RSI SignalsBINANCE:LINKUSDT has been in a downtrend since December, grinding inside a falling channel for 2 months, and it's now sitting right above the key ~$10.00 demand zone.
Price Action
• Price is respecting both bounds of a well-defined falling channel.
• Currently consolidating just above the demand area, early signs of potential strength.
RSI Insights
• Clear bullish divergence at demand zone retest.
• RSI could be approaching a breakout of its multi-month downtrend — worth watching closely.
Key Zones
• Support: $9.5–$10.5 is critical. It held last time and could fuel a reversal. If broken, it would invalidate the setup.
• Resistance: Falling channel upper boundary.
• Confirmation: RSI breakout + channel breakout = potential confirmation of trend reversal.
Also watch $15.5-$16 (previous S/R) and the whole $18-$20 area, which previously acted as support and has a high volume traded. Both could be good levels to take profits, together with the main supply zone in the $25-$27 area.
Still in a No-Trade Zone until a breakout is confirmed.
