2018 Cycle Repeat? Bullish Bitcoin Until End of YearSee my DXY analysis for my full view on the performance on bitcoin (and other risk assets as well)
-Summary- bullish like 2018 until end of year.
-This chart pointing out time frames of past cycles, the over all market structure of bitcoins price, and the transformation of a bullish trend into the parabolic. (where I think we are now)
Bullish Patterns

USD Price Action Correlation with Bitcoin PriceIn the later stages of the liquidity cycle you have a devaluation of USD leading to bitcoin breaking out of its bullish trend into a parabolic trend.
-Last 2 cycles this predictive correlation leaded bitcoins breakout by 4 to 6 months.
-Current cycle DXY/Bitcoin charts look very similar to 2018
Taking this correlation into account, we could likely see the bullish trend on Bitcoin transform into a parabolic trend sometime between May and June. Meaning, we are in the final stages of a bottoming in Bitcoin at the time of this post, likely about to continue bullish momentum as we just went through significate market strain. Removing the possibilities of another Black Swan event, like a major geopolitical event but it is my belief that this was already priced in from the markets reaction just this month. This being said, there are no certainties. Things could always get worse. Time will tell, but given my aforementioned annalists, the buying opportunity at this current point is to great to ignore. Reward greatly outweighing the risk.

ATOMUSDT Breakout And Potential RetraceHey Traders!
In today's session, we're keeping a close eye on ATOMUSDT as it presents a potential buying opportunity around the 4.13000 zone.
After trading in a prolonged downtrend, ATOM has successfully broken out, signaling a possible trend reversal. Right now, the pair is in a correction phase, and it’s approaching a key support/resistance level near the 4.13000 area — a critical retracement zone we’re watching for potential bullish continuation.
Trade safe, Joe.

Gold Is Forming a Bull Flag : Targeting a New ATH?Hey Traders, in today's trading session we are monitoring XAUUSD for a buying opportunity around 3280 zone, Gold is trading in an uptrend and currently is in a correction phase in which it is approaching the trend at 3280 support and resistance area.
Trade safe, Joe.

RARE/USDT: LOW RISK, HIGH REWARD SETUP!!🚀 RARE Breakout Alert – 150%+ Potential Incoming?! 👀🔥
Hey Traders! If you're all about high-conviction plays and real alpha, smash that 👍 and tap Follow for more setups that actually deliver! 💹💯
RARE/USDT just broke out of a symmetrical triangle on the 4H chart and is now perfectly retesting the breakout trendline. If this level holds, we could be gearing up for a massive upside move in the coming days. 📈🔥
🔹 Entry: CMP
🔹 Targets: 130%–150%
🔹 SL: $0.0538
🔹 Leverage: Low (Max 5x recommended)
💡Strategy Tip: Go in with tight risk management. Consider adding on spot for a safer ride!
💬 What’s Your Take?
Jumping in early or waiting for confirmation? Let’s chart this journey together—drop your analysis, targets, or questions in the comments! 💰🧠

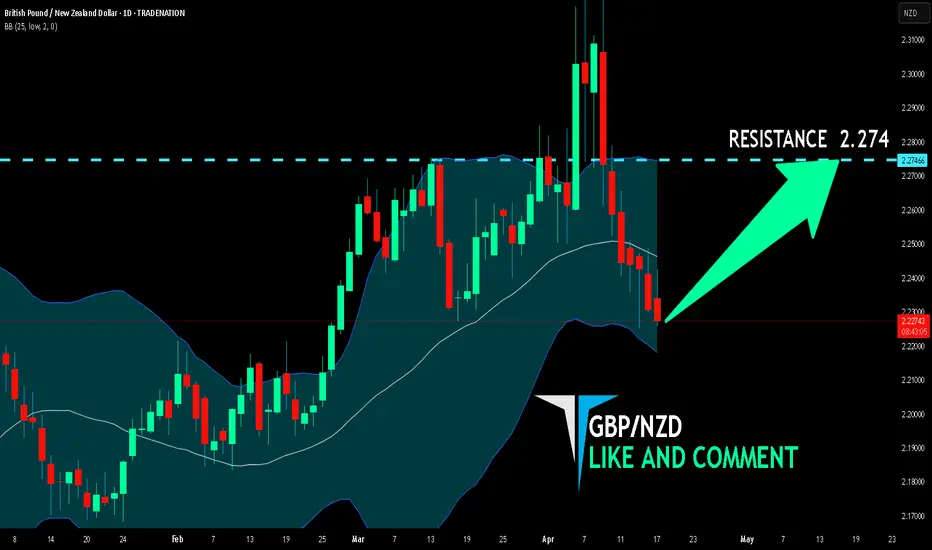
GBP/NZD BULLS ARE STRONG HERE|LONG
Hello, Friends!
GBP/NZD is making a bearish pullback on the 1D TF and is nearing the support line below while we are generally bullish biased on the pair due to our previous 1W candle analysis, thus making a trend-following long a good option for us with the target being the 2.274 level.
Disclosure: I am part of Trade Nation's Influencer program and receive a monthly fee for using their TradingView charts in my analysis.
✅LIKE AND COMMENT MY IDEAS✅
Is This The End of Pullback?BINANCE:SUPERUSDT has entered the support zone between 0.5142 – 0.4754 after a strong impulsive move to the upside.
This support zone is considered valid due to multiple rejections that occurred within this area in the past—indicating strong buyer interest.
Ideally, this is where we expect price to bounce and resume the bullish trend. The first sign of confirmation would be a break above 0.5272, which may open the path toward higher targets.
However, the bullish scenario remains valid only if the price stays above 0.4983—a key invalidation level.
Note:
If this level is breached before a clear candlestick confirmation, the candle pattern being used to validate the move becomes invalid.
Even if the price breaks below the invalidation level, as long as it remains within the support zone, the support is still valid — but it would require the formation of a new bullish candlestick pattern to re-confirm the potential for an upward move.

TESLA | Weekly HTF TargetAfter having a deep retracement ~70% tesla looks ready to reach Higher Highs...
New High target: $490+

Title: Rumble Stock: Bullish on Live Stream Growth *Grok made this based off what i told it*
Description: Rumble’s record 718,909 live viewers during the 2024 debate (Streams Charts) suggest strong North American dominance. Despite $338.36 million losses in 2024 (Yahoo Finance), analyst target is $15.00 (StockAnalysis). Buy at $7.50, target $15.00, stop-loss at $5.00. RSI at 45 indicates neutral momentum, with support at $6.50.

HTZ UP AROUND 22% TODAY. ACTIVIST INVESTOR BOUGHT $46.5M SHARES!HERTZ (HTZ) Surged nearly 22% today. A recently report revealed "Activist" Investor Bill Ackman had acquired $46.5 million shares . Should you hop on the bullish trend? Or will price cool off once the hype is over? What are your thoughts?
Disclaimer: Not Financial Advice

XRP - Breakout will push the price to 5+ USDPrice got reject around the previous resistance line formed after hitting the new ATH on 2017. After 7 long years XRP was able to hit the previous ATH value.
After getting reject from the ATH XRP is trading inside the channel, a breakout from this channel would push the price to previous ATH and a strong breakout from previous resistance is needed to reach new ATH.
Lets see if the price break the channel.
Cheers!
GreenCrypto

Bitcoin - Trading below 50 and 200 EMACurrently bitcoin is trading below 50 and 200 EMA after multiple failed attempt to breach the these EMA levels. 1D candle closed above 200 EMA however, failed to close above 50 EMA
Additionally price is around the trendline which is acting as resistance, a strong breakout from this resistance is needed for bullish momentum to continue.
In the next couple of days we will get to know if price will break the resistance or gets rejected.
Stay tuned for more updates
Cheers
GreenCrypto

GBPUSD Potential UpsidesHey Traders, in today's trading session we are monitoring GBPUSD for a buying opportunity around 1.32300 zone, GBPUSD is trading in an uptrend and currently is in a correction phase in which it is approaching the trend at 1.32300 support and resistance area.
Trade safe, Joe.

XRP Long Swing Setup – Key Support IncomingXRP is pulling back and now approaching a critical support zone between $1.85 - $2.00. This area has historically acted as a launchpad for bullish momentum, and with the broader market eyeing a bounce, it offers a strong risk-to-reward opportunity.
🛒 Entry Zone:
$1.85 – $2.00
🎯 Take Profit Targets:
🥇 $2.20 – $2.35
🥈 $2.60 – $2.75
🛑 Stop Loss:
Just below $1.70 (keep an eye on daily candle closes)

Celsius Holdings (CELH) – Fueling the Wellness Energy RevolutionCompany Snapshot:
Celsius NASDAQ:CELH is a top-tier functional beverage brand, capitalizing on the explosive growth of health-conscious energy drinks. Known for its clean-label, metabolism-boosting formulas, CELH is a favorite among fitness enthusiasts and wellness-driven consumers.
Key Catalysts:
Strategic Acquisition – Alani Nu 🎯
Expands CELH’s reach into the women-centric energy drink market
Enhances brand diversity and strengthens product portfolio
Accelerates penetration into lifestyle & wellness channels
PepsiCo Distribution Partnership 📦
Unlocks massive scale and global shelf visibility
Boosts velocity in convenience, grocery, and fitness retail
Strategic alignment continues to fuel international expansion
Clean Energy Demand on the Rise 🌱
Consumers are actively shifting from sugary and synthetic brands to low-calorie, functional alternatives
Celsius delivers on performance + wellness—a powerful consumer value prop
Brand Loyalty & Community 👟
Strong digital engagement with a cult-like following
Supported by fitness influencers, events, and brand ambassadors
Investment Outlook:
✅ Bullish Above: $30.00–$31.00
🚀 Upside Target: $52.00–$53.00
📈 Growth Drivers: New market segments, global scaling via Pepsi, clean-energy trend momentum
📢 CELH: Redefining energy drinks with purpose, performance, and wellness.
#CELH #FunctionalBeverages #CleanEnergy #WellnessTrend

$10 to $80 in 1 day $BULL$10 to $80 in 1 day 💣 How do you know market is in a bubble?
When NASDAQ:HOOD valuation is so high their competitor NASDAQ:BULL decides to do IPO to catch some of the makert delusion going on and they fit right into all of it with their value going from $260 Million to $2 Billion in a day

USOIL BULLS WILL DOMINATE THE MARKET|LONG
USOIL SIGNAL
Trade Direction: long
Entry Level: 60.44
Target Level: 73.81
Stop Loss: 51.51
RISK PROFILE
Risk level: medium
Suggested risk: 1%
Timeframe: 1D
Disclosure: I am part of Trade Nation's Influencer program and receive a monthly fee for using their TradingView charts in my analysis.
✅LIKE AND COMMENT MY IDEAS✅

Bitcoin Bull Pennant / Falling Wedge BreakoutBINANCE:BTCUSDT recently broke out of a Bull Pennant / Falling Wedge, and seems to be retesting the resistance as support.
This follows two leading RSI signals:
• RSI downtrend breakout
• RSI bull divergence
Breakout Targets
• $115K — Falling Wedge measured move
• $130K — Pennant projection
Key Levels to Watch
• $72K — Main support + invalidation (former resistance + 0.618 Fib from 49K–109K)
• $91.5K — Prior support, now a key resistance to reclaim
• $109.5K — All-Time High

GBP/CAD BULLS WILL DOMINATE THE MARKET|LONG
Hello, Friends!
GBP/CAD is making a bearish pullback on the 1D TF and is nearing the support line below while we are generally bullish biased on the pair due to our previous 1W candle analysis, thus making a trend-following long a good option for us with the target being the 1.841 level.
Disclosure: I am part of Trade Nation's Influencer program and receive a monthly fee for using their TradingView charts in my analysis.
✅LIKE AND COMMENT MY IDEAS✅

DOGE Trade Setup – Structure Shift in Progress?DOGE just swept the $0.13 liquidity, shaking out weak hands, but price is still holding strong above the $0.15 key support zone. If we get a daily close above $0.18, that could lock in a bullish structure shift and kickstart the next leg up.
📌 Trade Details:
Entry: Around $0.16
Take Profit Targets:
🥇 $0.23
🥈 $0.30
Stop Loss: Daily close below $0.14

atom buy midterm"🌟 Welcome to Golden Candle! 🌟
We're a team of 📈 passionate traders 📉 who love sharing our 🔍 technical analysis insights 🔎 with the TradingView community. 🌎
Our goal is to provide 💡 valuable perspectives 💡 on market trends and patterns, but 🚫 please note that our analyses are not intended as buy or sell recommendations. 🚫
Instead, they reflect our own 💭 personal attitudes and thoughts. 💭
Follow along and 📚 learn 📚 from our analyses! 📊💡"

PAAL Trade Setup – Early Signs of RecoveryPAAL is flashing early trend reversal signals with a reclaim of the 20-day SMA and confirmation of a double bottom around the $0.09 zone. Now that price has flipped $0.14 back into support, bulls could be ready to push higher.
📌 Trade Details:
Entry Zone: Around $0.14
Take Profit Targets:
🥇 $0.20
🥈 $0.27
Stop Loss: Daily close below $0.11

Bullish??? That was all very sudden, is it over now?The market correction really seamed to be an over reaction. I am hopeful that the worst is behind us, at least for the meantime.
maybe this will be closer to 2018 correction and we just keep grinding higher for the rest of the year. I suppose anything is possible.
-Everyone got way to bearish to quick - Spidey senses going off!
-we never copy and paste last cycle to the next, but people have such a recency bias, sometimes its all they can see ( I may know from experience)
- hopefully bullish
