$BTC Retests 50WMA For The First Time in 217 DaysAs expected,
CRYPTOCAP:BTC retested the 50WMA for the first time since September 2024 (217 days ago).
₿itcoin historically has outsized reactions when this happens.
Bullish Patterns

eth buy midterm "🌟 Welcome to Golden Candle! 🌟
We're a team of 📈 passionate traders 📉 who love sharing our 🔍 technical analysis insights 🔎 with the TradingView community. 🌎
Our goal is to provide 💡 valuable perspectives 💡 on market trends and patterns, but 🚫 please note that our analyses are not intended as buy or sell recommendations. 🚫
Instead, they reflect our own 💭 personal attitudes and thoughts. 💭
Follow along and 📚 learn 📚 from our analyses! 📊💡"

HERTZ (HTZ) SEES BULLISH MOVEMENT DESPITE TARIFFSHertz (HTZ) saw a bullish open this morning. Conversely many other assets saw a bearish open. Will Hertz continue this bullish movement, or could this be just a sell off that leads to a stronger downtrend?

BTC - One More Leg...Hello TradingView Family / Fellow Traders!
This is Richard, also known as theSignalyst.
📉 BTC has been overall bearish , trading within the falling channel marked in red.
But the big question is — where could the potential bottom be?
👉 I’m watching the $70,000 zone!
Here’s why:
The $70,000 area is a key confluence zone — it aligns with the lower red trendline, horizontal support, a psychological round number, and a potential demand zone.
📚 According to my trading style:
As #BTC approaches the blue circle zone, I’ll be looking for bullish reversal setups — such as a double bottom pattern, trendline break, and more.
📚 Reminder:
Always stick to your trading plan — entry, risk management, and trade management are key.
Good luck, and happy trading!
All Strategies Are Good, If Managed Properly!
~Rich

SILVER SENDS CLEAR BULLISH SIGNALS|LONG
SILVER SIGNAL
Trade Direction: long
Entry Level: 3,050.2
Target Level: 3,274.5
Stop Loss: 2,899.9
RISK PROFILE
Risk level: medium
Suggested risk: 1%
Timeframe: 8h
Disclosure: I am part of Trade Nation's Influencer program and receive a monthly fee for using their TradingView charts in my analysis.
✅LIKE AND COMMENT MY IDEAS✅

USD/JPY BULLS ARE GAINING STRENGTH|LONG
USD/JPY SIGNAL
Trade Direction: long
Entry Level: 146.235
Target Level: 150.962
Stop Loss: 143.090
RISK PROFILE
Risk level: medium
Suggested risk: 1%
Timeframe: 1D
Disclosure: I am part of Trade Nation's Influencer program and receive a monthly fee for using their TradingView charts in my analysis.
✅LIKE AND COMMENT MY IDEAS✅

NZD/USD BULLISH BIAS RIGHT NOW| LONG
Hello, Friends!
We are going long on the NZD/USD with the target of 0.568 level, because the pair is oversold and will soon hit the support line below. We deduced the oversold condition from the price being near to the lower BB band. However, we should use low risk here because the 1W TF is red and gives us a counter-signal.
Disclosure: I am part of Trade Nation's Influencer program and receive a monthly fee for using their TradingView charts in my analysis.
✅LIKE AND COMMENT MY IDEAS✅

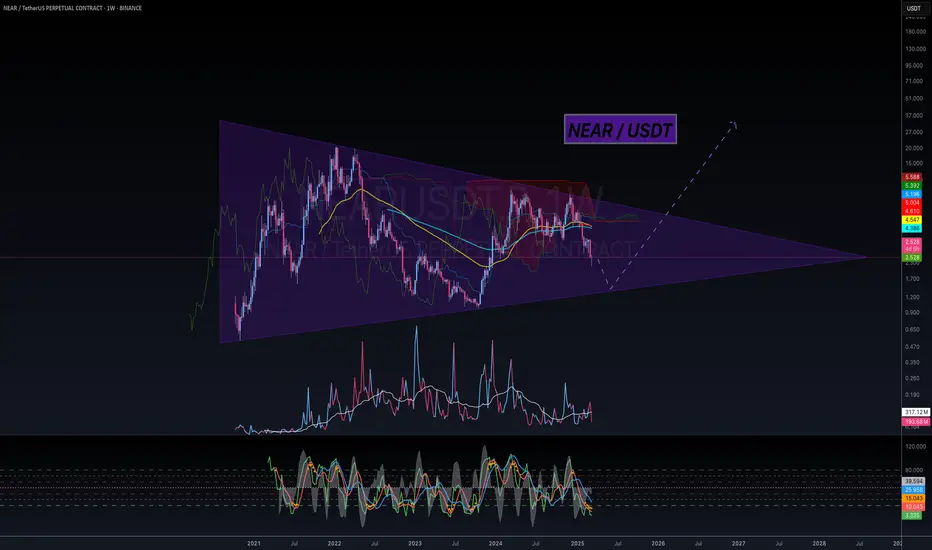
I'm Bullish, but... NEAR / USDTHello again my brothers and sisters,
3 Drive Structure, do I need to say anything else?
I mean, look at this symmetrical triangle, when this blows, in the past, did it only touch base twice? I dont think so, 3 drive structure is needed for this and then we can be extremely bullish!
I'll be loading my boat down there.
If this helped you out, let me know!
Trade thirsty!
I'm Bullish, but... BTC / USDHello my friends,
At a minimum we're looking at 30 days inside this wedge before breaking out and testing the $96k range once again. Trust me, Bitcoin must form a bullish structure before doing anything interesting.
It could wick to FWB:73K but I'm thinking the heavy orders around $75k might hold and we range instead of dumping more.
Keep an eye on this wedge.
Trade thirsty, my friends!

I'm Bullish, but... MANA / USDTHi friends,
My latest post about MANA was bullish, and I did buy some of the blood we just had.
But this would be another coin that could drop 25% - 30% giving a great opportunity.
Keep an eye on BTC cause if it dumps, this will happen.
Trade thirsty!

DOT - Strong bounce from the ultimate low ?Bounced each time for consequent gains around 3.75, so I expect the same now
placed a SL a bit wide, a good fuel could be the 2.0 update of Polkadot but didn hear any news about it to be honest
In the other hand, lower would means I'll quit this asset for a mid/long term hehe,
Cheers

$BTC Inverse Head and Shoulders Finally FormedAnd just like that, the Death Cross has formed the right shoulder for the Inverse H & S idea I formed on March 14th
We may sit a bit more downside to retest the 50WMA at $76k for confirmation
If we get a V-shaped recovery tomorrow, this very well could be the bottom for CRYPTOCAP:BTC

$QQQ Has Officially Entered a Bear Market $SPX is CloseNASDAQ HAS OFFICIALLY ENTERED A BEAR MARKET, DOWN ~22%
NASDAQ:QQQ 2022 Bear Market bottomed ~37%
just below the 200WMA
S&P 500 is not quite there yet, down only ~17.5%
SP:SPX 2022 Bear Market bottomed ~27% a tick below the 200WMA

USOIL BEST PLACE TO BUY FROM|LONG
USOIL SIGNAL
Trade Direction: long
Entry Level: 62.31
Target Level: 71.18
Stop Loss: 56.40
RISK PROFILE
Risk level: medium
Suggested risk: 1%
Timeframe: 1D
Disclosure: I am part of Trade Nation's Influencer program and receive a monthly fee for using their TradingView charts in my analysis.
✅LIKE AND COMMENT MY IDEAS✅

GBP/USD BULLS ARE STRONG HERE|LONG
Hello, Friends!
We are now examining the GBP/USD pair and we can see that the pair is going down locally while also being in a downtrend on the 1W TF. But there is also a powerful signal from the BB lower band being nearby indicating that the pair is oversold so we can go long from the support line below and a target at 1.302 level.
Disclosure: I am part of Trade Nation's Influencer program and receive a monthly fee for using their TradingView charts in my analysis.
✅LIKE AND COMMENT MY IDEAS✅

EUR/USD BULLS WILL DOMINATE THE MARKET|LONG
Hello, Friends!
The BB lower band is nearby so EUR-USD is in the oversold territory. Thus, despite the downtrend on the 1W timeframe I think that we will see a bullish reaction from the support line below and a move up towards the target at around 1.110.
Disclosure: I am part of Trade Nation's Influencer program and receive a monthly fee for using their TradingView charts in my analysis.
✅LIKE AND COMMENT MY IDEAS✅

CAD/CHF SENDS CLEAR BULLISH SIGNALS|LONG
Hello, Friends!
Previous week’s red candle means that for us the CAD/CHF pair is in the downtrend. And the current movement leg was also down but the support line will be hit soon and lower BB band proximity will signal an oversold condition so we will go for a counter-trend long trade with the target being at 0.613.
Disclosure: I am part of Trade Nation's Influencer program and receive a monthly fee for using their TradingView charts in my analysis.
✅LIKE AND COMMENT MY IDEAS✅

$VIX Hits 45! $BTC Historically Pumps Soon AfterThe TVC:VIX has only hit above 45 on 5 occasions in the history of CRYPTOCAP:BTC
Each time it did, BTC pumped at least 20%

ADA Spot Trade Setup – Support Level OpportunityCardano (ADA) is currently sitting at a key support zone, presenting a solid risk-to-reward long opportunity if bulls can hold the level.
🛠 Trade Plan:
Entry: $0.63 – $0.70
Take Profit Targets:
$0.78 – $0.84 (First Target)
$0.96 – $1.02 (Extended Target)
Stop Loss: Just below $0.58

Nintendo Co., Ltd. (NTDOY) – Powering Up for the Next Level Company Snapshot:
Nintendo OTC:NTDOY continues to dominate global entertainment with iconic franchises, cross-platform expansion, and the highly anticipated Switch 2 in 2025.
Key Catalysts:
Switch 2 Launch in 2025 🚀
150M+ Switch units sold → massive installed base
Backward compatibility + hardware upgrades could drive a super-cycle in hardware/software sales.
Franchise Diversification 💡
Digital Pokémon card game gaining momentum → strong in-app revenue potential
The Super Mario Bros. Movie surpassed SEED_TVCODER77_ETHBTCDATA:1B + in global box office 🍿
Expanding theme park partnerships (Universal Studios) enhance recurring brand engagement
Multi-Channel Monetization 📱🎢
Transitioning beyond consoles: movies, mobile, merchandise, and theme parks
Reinforces IP value and opens new revenue verticals
Investment Outlook:
✅ Bullish Above: $15.50–$16.00
🚀 Upside Target: $27.00–$28.00
📈 Growth Drivers: Switch 2 super-cycle, diversified IP monetization, and brand strength
🍄 Nintendo – Not just gaming, but a global entertainment powerhouse. #NTDOY #Switch2 #Nintendo

BTCUSD Weekly Log ChartOften preceding the general market movement, bitcoin currently holds its support pretty well.

LTC - Bulls Getting Ready!Hello TradingView Family / Fellow Traders. This is Richard, also known as theSignalyst.
📈 Long-term, LTC has been overall bullish, trading within the rising channel marked in red.
📍 As it retests the lower bound of the channel — perfectly intersecting with the blue support—I will be looking for medium-term longs.
🚀 For the bulls to take over long-term and initiate the next bullish phase, a breakout above the last major high marked in orange at $97 is needed.
📚 Always follow your trading plan regarding entry, risk management, and trade management.
Good luck!
All Strategies Are Good; If Managed Properly!
~Rich

AUD/CAD BUYERS WILL DOMINATE THE MARKET|LONG
AUD/CAD SIGNAL
Trade Direction: long
Entry Level: 0.880
Target Level: 0.889
Stop Loss: 0.874
RISK PROFILE
Risk level: medium
Suggested risk: 1%
Timeframe: 1h
Disclosure: I am part of Trade Nation's Influencer program and receive a monthly fee for using their TradingView charts in my analysis.
✅LIKE AND COMMENT MY IDEAS✅
