S Trade Setup - Waiting for Retrace to SupportS has had a strong rally over the last two weeks and is now at resistance. We’re waiting for a retrace to the next support level before entering a long spot trade.
🛠 Trade Details:
Entry: Around $0.55
Take Profit Targets:
$0.62 (First Target)
$0.74 - $0.80 (Mid Target)
$0.91 - $0.98 (Extended Target)
Stop Loss: Just below $0.48
We'll be watching for confirmation of support before executing the trade! 📈🔥
Bullish Patterns

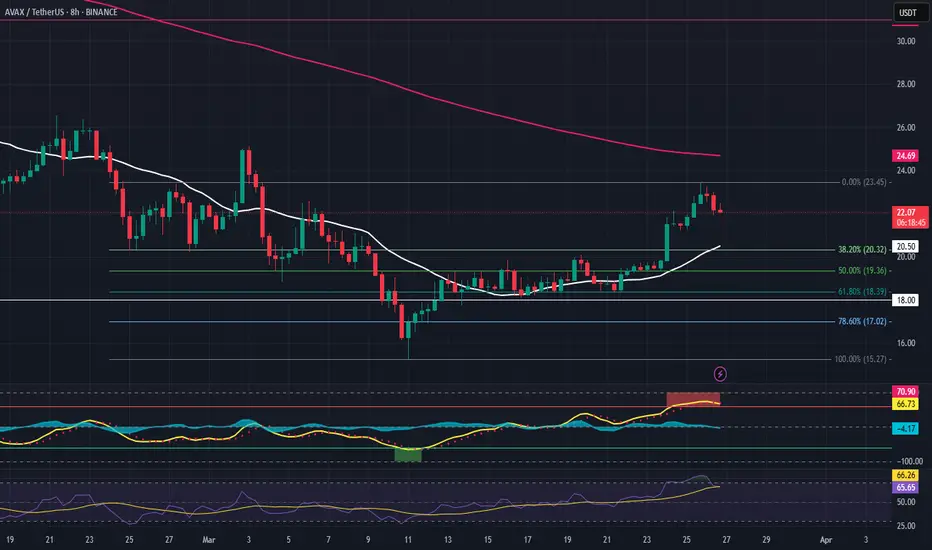
AVAX Trade Setup - Waiting for Retrace to SupportAVAX has had a strong run over the last two weeks. Now, we're waiting for a retrace to key support before entering a long spot trade.
🛠 Trade Details:
Entry: Around $20.00
Take Profit Targets:
$23.50 (First Target)
$31.00 (Extended Target)
Stop Loss: Just below $18.00
Watching for buying pressure at the support level before confirming the move! 📈🔥
USOIL - NEW BREAKOUTHello Traders !
The USOIL price broke the resistance level (68.427 - 68.703).
This key level becomes new support !
So, I expect a bullish move🚀
_______________
TARGET: 70.080🎯

NZDJPY - Bullish Double BottomHello Traders !
The NZDJPY price formed a double bottom pattern.
Currently, The neckline is broken !
So, I expect a bullish move🚀
_____________
TARGET: 86.990🎯

GOLD - Eyeing Two Levels!Hello TradingView Family / Fellow Traders. This is Richard, also known as theSignalyst.
📈 XAUUSD remains overall bullish in both the short and medium term, trading within the rising channels marked in orange and green.
🔍 Here are two key levels I'm watching for potential trend-following long setups:
1️⃣$3,000 – A psychological round number that aligns with the lower orange trendline.
2️⃣$2,950 – A support level that intersects with the lower blue trendline.
Let’s see if the bulls hold the line! 🐂✨
📚 Always follow your trading plan regarding entry, risk management, and trade management.
Good luck!
All Strategies Are Good; If Managed Properly!
~Rich
Disclosure: I am part of Trade Nation's Influencer program and receive a monthly fee for using their TradingView charts in my analysis.

ZEC/USDT: Breakout in Play – 100%+ Upside Move Incoming?🚀 Hey Traders! ZCASH Breakout Alert – 100%+ Move Loading? 👀🔥
If you’re pumped for this setup, smash that 👍 and hit Follow for premium trade ideas that actually deliver! 💹🔥
🔥 ZEC/USDT – Massive Breakout in Play! 🚀
ZEC is breaking out from a symmetrical triangle on the 6H timeframe and has successfully retested it, confirming the breakout. 💥
With this solid retest, ZEC looks poised for a 100%+ upside move.
Long some here with low leverage and add more on dips to ride the wave higher. 🚀
💰 Trade Setup:
📍 Entry: CMP and add more up to $35
🎯 Targets: $41 / $52 / $63 / $72 📈
🛑 Stop-Loss: $32.80
⚡ Leverage: Use low lev (Max 5x)
🔎 Strategy:
✅ Enter with low leverage now
✅ Add more on dips and ride the breakout momentum 🚀
💬 What’s Your Take?
Are you bullish on ZEC’s breakout potential? Share your targets, analysis, and predictions in the comments! Let’s crush it and secure those gains together! 💰🔥🚀

Tesla PushI see a valid break and retest forming with nice volume
the trade is simple
Im buying the retest of the break and im taking my trade to the breakout high
most likely im going to get 50% of the move back to the high either way im going to make cash

UNI Trade Setup - Strength After Liquidity SweepUNI has swept underside liquidity and is now holding strong. If price consolidates above $7, we’ll be looking for local lows to form, setting up a medium-term move higher as broader markets push into resistance.
🛠 Trade Details:
Entry: Around $7 zone
Take Profit Targets:
$10.50 – $11.00 (First Target)
$14.50 – $15.00 (Extended Target)
Stop Loss: Daily close below $5.5
Waiting for market confirmation before positioning for the next leg up! 📈🚀

LINK Trade Setup - Higher Low ConfirmationLINK is showing early signs of reversal from a key higher timeframe support zone. We anticipate a short-term dip into the buy zone before shifting into an expansion phase.
🛠 Trade Details:
Entry: $13 – $14 (Buy Zone)
Take Profit Targets:
$17.00 - $17.70 (Initial Resistance)
$21.70 - $22.40 (Breakout Target)
Stop Loss: Daily close below $12
Looking for higher low confirmation before the move up. 📈🚀

S/USDT: FALLING WEDGE BREAKOUT!! 🚀 Hey Traders! SONIC Breakout Alert – ATH Incoming? 👀🔥
If you’re excited for this setup, smash that 👍 and hit Follow for premium trade ideas that actually deliver! 💹🔥
🔥 SONIC/USDT – Breakout & Retest in Play! 🚀
SONIC is breaking out of a falling wedge on the 4H timeframe and is currently retesting the breakout level. With momentum building, we’re expecting a move toward ATH soon.
💰 Trade Setup:
📍 Entry: CMP, add more up to $0.50
🎯 Targets: $0.56 / $0.62 / $0.69 / $0.78 / $0.85 / $0.96
🛑 Stop-Loss: $0.46
⚡ Leverage: Low (Max 5x)
🔎 Strategy:
Enter with low leverage now
Add more on dips and ride the wave higher
💬 What’s Your Take?
Are you bullish on SONIC’s breakout? Share your analysis, predictions, and strategies in the comments! Let’s lock in those gains and ride this pump together! 💰🚀🔥

DOW JONES - FAKE BREAKDOWNHello Traders !
The US30 failed to break the support level (41603 - 41958).
The price formed a bullish candlestick pattern.
So, I expect a bullish move🚀
_______________
TARGET: 42965🎯

USDJPY BUY📊 EUR/JPY - Order Block & Break of Structure (BOS) Strategy 📊
Tracking EUR/JPY on the 15-minute timeframe, we see a potential bullish setup based on order blocks (OBs) and smart money concepts (SMC). However, confirmation via Break of Structure (BOS) on lower timeframes will be key before entering a trade.
Key Zones:
Bullish Order Block (Demand Zone): 161.000 - 160.700
Expecting price to drop into this area, where institutions previously showed strong buying pressure.
Looking for BOS on lower timeframes (M5/M1) to confirm bullish intent before entering a buy position.
Bearish Order Block (Supply Zone): 163.500 - 163.700
A strong resistance level where price previously sold off.
If price reaches this area, we could see a reaction or potential reversal.
Trade Plan:
📉 Wait for price to enter the demand zone (161.000 - 160.700).
🔎 Look for a Break of Structure (BOS) on lower timeframes (M5/M1) to confirm bullish reversal.
✅ Enter a long position upon confirmation.
🎯 Targeting the supply zone at 163.500 - 163.700.
⚠️ Stop-loss below 160.700 to manage risk.

S - Roadmap to $1S has been overall bullish trading within the rising channel marked in blue.
Currently, S is retesting the upper boundary of the channel and a key structure at $0.63.
For the bulls to stay in control and aim for the $1 round number, a break above $0.63 is needed.
In the meantime, if S retests the lower boundary of the blue channel and the $0.50 round number, we will be looking for trend-following long opportunities.

IP/USDT: BREAKOUT ALERT!!🚀 Hey Traders! IP Breakout Alert – 80% Move on the Horizon? 👀🔥
If you’re pumped for this setup, smash that 👍 and hit Follow for premium trade ideas that actually deliver! 💹🔥
🔥 IP/USDT – Massive Breakout in Play! 🚀
IP is breaking out from a triangle on the 4H timeframe and looks primed for a 70-80% upside move. This setup has huge potential, making it a must-watch trade. 💥
💰 Trade Setup:
📍 Entry: $6.10 – $6.35
🎯 Targets: $6.96 / $7.84 / $8.92 / $11.2 📈
🛑 Stop-Loss: $5.78
⚡ Leverage: Use low lev (Max 5x)
🔎 Strategy:
✅ Enter with low leverage now
✅ Add more on dips and ride the breakout momentum 🚀
💬 What’s Your Take?
Are you bullish on IP’s breakout potential? Share your targets, analysis, and predictions in the comments! Let’s crush it and lock in those gains! 💰🔥🚀

PCBL STRONG BREAKOUT Cash Call:
PCBL
Buy above 437.0
TGT 450.0
Stoploss 428.0
All data given here only for education Purpose Only

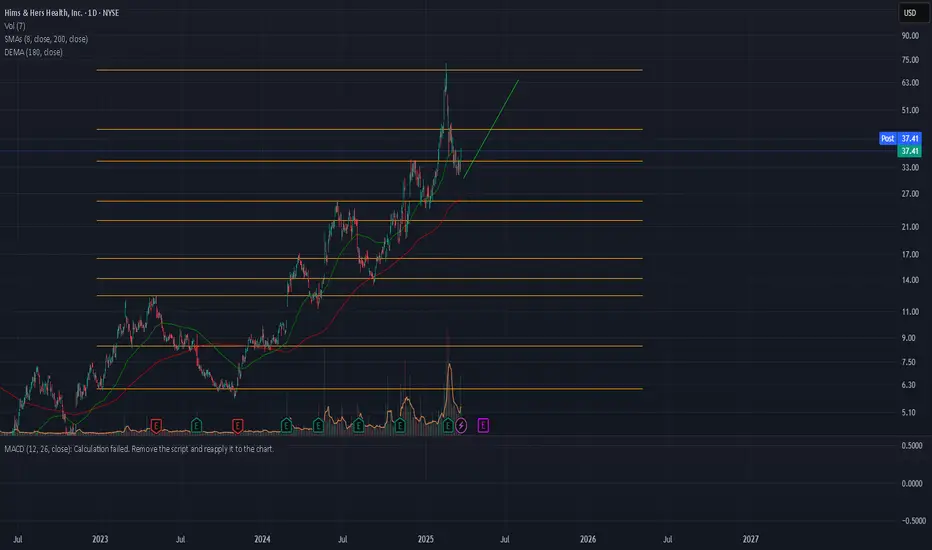
$HIMS Hair, Health, Hello!I guess I might be jumping on the Bandwagon. Everything is growing with this one! Year over yr it's exploding, will this have a Zoom like fall? or a Monster rally? Time will tell and the dip makes this look like a great to start loading up.
EASY $280Hey, I'm back with $TSLA.
Buy now! It will reach $283 soon.
+ Let's see if NASDAQ:TSLA breaks $283.
I don't need to explain why it will rise again cause the selloff has been too intense (oversold), and all the bad news is already factored in.
We buy in fear and sell in greed

avax buy limit midterm "🌟 Welcome to Golden Candle! 🌟
We're a team of 📈 passionate traders 📉 who love sharing our 🔍 technical analysis insights 🔎 with the TradingView community. 🌎
Our goal is to provide 💡 valuable perspectives 💡 on market trends and patterns, but 🚫 please note that our analyses are not intended as buy or sell recommendations. 🚫
Instead, they reflect our own 💭 personal attitudes and thoughts. 💭
Follow along and 📚 learn 📚 from our analyses! 📊💡"

BEAM Trade Setup - Gaming Sector StrengthWith the gaming sector holding strong, BEAM is showing signs of momentum after forming a higher low, signaling a possible upward move.
🛠 Trade Details:
Entry: Around $0.0075 (Support Level)
Take Profit Targets:
$0.0083 (Initial Resistance Zone)
$0.0098 (Breakout Zone)
$0.011 (Major Resistance Target)
Stop Loss: $0.0067
Looking for bullish confirmation before entry. 🎮🚀

Zai Lab (ZLAB) – Biotech Growth & Profitability PathCompany Overview:
Zai Lab NASDAQ:ZLAB , a leading Chinese biotech firm, is on track for non-GAAP profitability by Q4 2025, driven by strong revenue growth & cost management.
Key Catalysts:
Financial Discipline & Expansion 💰
Operating losses fell 45% in Q4 2024, highlighting cost efficiency while scaling operations.
Analysts project $2 billion in annual revenue by 2028, reinforcing long-term value creation.
Blockbuster Drug Pipeline 💊
VYVGART generated $93.6M in its first full launch year, demonstrating strong adoption.
KarXT & bemarituzumab are key upcoming growth drivers, expanding ZLAB’s market footprint.
Investment Outlook:
Bullish Case: We are bullish on ZLAB above $34.00-$35.00, supported by financial execution & product expansion.
Upside Potential: Our price target is $54.00-$55.00, driven by strong product adoption & long-term growth trajectory.
🔥 Zai Lab – Unlocking the Future of Biotech Innovation. #ZLAB #Biotech #GrowthStocks

Cosmos Atom BullishI am not a financial advisor. This is not meant to be and does not constitute financial, investment, trading, or any other types of advice or recommendation.

GBPUSD - Chasing the Bulls!!Hello TradingView Family / Fellow Traders. This is Richard, also known as theSignalyst.
📈GBPUSD has been overall bullish trading within the rising channel marked in red.
Moreover, the blue zone is a major daily support.
🏹 Thus, the highlighted blue circle is a strong area to look for buy setups as it is the intersection of daily support zone and lower red trendline acting as a non-horizontal support.
📚 As per my trading style:
As #GBPUSD approaches the blue circle zone, I will be looking for bullish reversal setups (like a double bottom pattern, trendline break , and so on...)
📚 Always follow your trading plan regarding entry, risk management, and trade management.
Good luck!
All Strategies Are Good; If Managed Properly!
~Rich
Disclosure: I am part of Trade Nation's Influencer program and receive a monthly fee for using their TradingView charts in my analysis.

QTUM is almost ready...NASDAQ:QTUM -@qtum
Qtum is a smart contract platform forked from Bitcoin Core and Ethereum.🔐
#QTUM rejected the $2 support level and round number.
For the bulls to take control in the medium term, a break above the inverse head and shoulders neckline marked in orange at $2.47 is needed.🚀
