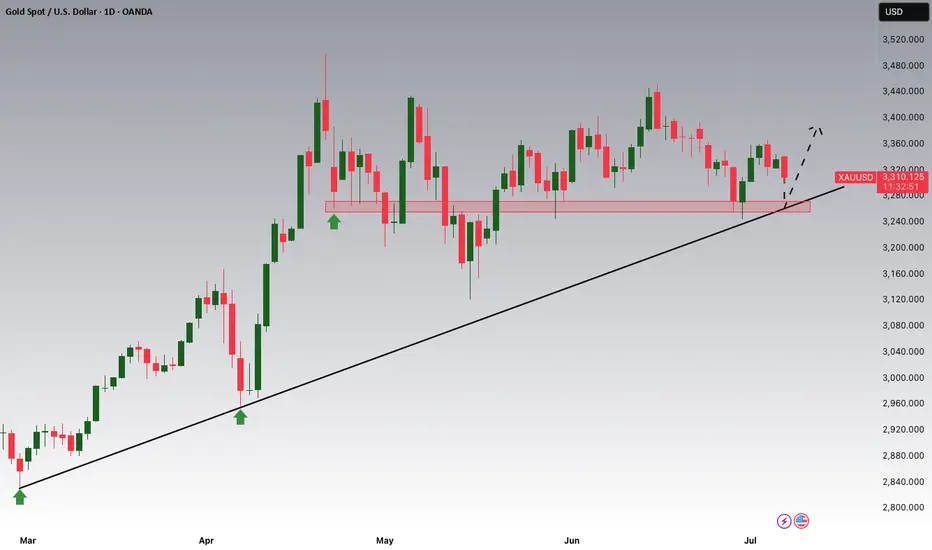
Gold is Nearing The Daily TrendHey Traders, in today's trading session we are monitoring XAUUSD for a buying opportunity around 3,260 zone, Gold is trading in an uptrend and currently is in a correction phase in which it is approaching the trend at 3,260 support and resistance area.
Trade safe, Joe.
Bullish Patterns
Stellar Lumens Looks Ready for Blast-Off!There is a very similar trend happening with the technology of the internet and computing as what we’re seeing now with AI and crypto. The early accumulation cycle for Nvidia would have shaken out many investors simply because of how long it took before going parabolic. Stellar Lumens is showing the same pattern—but the wait could be over. I see a large parabolic run coming for Stellar Lumens very soon, one that could take us to new all-time highs and spark a mass adoption cycle similar to what happened with internet and computing technology.
As always, stay profitable.
- Dalin Anderson

XAU/USD to $3300Historical price action, fractals, and fib extensions suggest $3300 target for XAU/USD

GBP/JPY: Total Confluence Targeting 202.05 BreakoutThis is a high-conviction trade setup based on a powerful confluence of fundamental drivers and multi-timeframe technical alignment. We are anticipating a bullish breakout in GBP/JPY, catalyzed by the upcoming UK GDP data release. The price action has formed a classic "coiled spring" pattern, indicating a significant buildup of energy before a potential move higher.
The analysis is based on pure price action, structure, and macroeconomics. The chart is kept intentionally clean to highlight the strength of the setup itself.
The Fundamental Why 📰
Two core data-driven factors underpin this trade:
1️⃣ Macro Policy Divergence: The primary long-term driver is the stark monetary policy difference between a relatively hawkish Bank of England (BoE), which is still fighting inflation, and an ultra-dovish Bank of Japan (BoJ). This fundamental imbalance creates a natural tailwind for GBP/JPY.
2️⃣ Positive Leading Indicators: Recent economic data from the UK has shown surprising strength. Both the Services and Manufacturing PMIs for June beat expectations, suggesting underlying resilience in the economy. This points to a higher probability of an upside surprise in Friday's GDP figures, which would be the direct catalyst for a breakout.
The Technical Picture 📊
Our confidence comes from a rare "Total Confluence," where every timeframe tells the same bullish story.
The Monthly Chart (Strategic View): Shows a powerful, multi-year uptrend that has decisively broken the critical 8-year resistance from the 2015 highs. The macro trend is undeniably bullish.
The Weekly Chart (The Confirmation): Confirms the uptrend is resuming now after breaking out of a year-long bullish continuation pattern. The "resting" phase appears to be over.
The 4-Hour Chart (The Setup): This is the "coiled spring." Price is consolidating in a very tight range right underneath the key breakout level of 199.45. This shows a lack of sellers and a buildup of buying pressure.
Fibonacci Confluence: Our take profit target is not random. It aligns perfectly with the 1.272 Trend-Based Fibonacci Extension, giving us objective, mathematical confirmation for the target at 202.05.
The Trade Plan ✅
This is a "set and forget" breakout strategy. The order should be placed as a Buy Stop to capture the momentum as it breaks higher.
📉 Asset: GBP/JPY
👉 Entry (Buy Stop): 199.85
⛔️ Stop Loss: 198.75
🎯 Take Profit: 202.05
🧠 Risk/Reward: 1:2
This analysis is for educational purposes. Always conduct your own research and manage your risk appropriately. Good luck.

DOGE Long Swing Setup – Musk-Fueled Hype & Political BuzzElon Musk’s launch of the “America Party” is reigniting interest in his potential impact on crypto—especially Dogecoin. With his history of moving DOGE’s price, this political pivot could stir volatility and renewed upside. We’re watching for a dip into the $0.15–$0.16 zone for a possible long entry.
📌 Trade Setup:
• Entry Zone: $0.15 – $0.16
• Take Profit Targets:
o 🥇 $0.19 - $0.20
o 🥈 $0.23 – $0.24
• Stop Loss: Daily close below $0.13

ETH Long Swing Setup – Sideways Hold with Dip-Buy OpportunityETH continues to hold above the key $2,300 support, showing resilience and consolidating within range. We’re watching for one more dip into the $2,300–$2,375 zone to trigger a long entry, with momentum building for a potential breakout.
📌 Trade Setup:
• Entry Zone: $2,300 – $2,375
• Take Profit Targets:
o 🥇 $2,900 – $3,000
o 🥈 $3,300 – $3,400
o 🥉 $4,000 – $4,200
• Stop Loss: Daily close below $2,000

Bulls Could "Wedge" Their Way Into Higher Prices On EGOANDA:EURGBP has made some impressive moves up since the Low from May 29th and Price just fell short of the Highs of April 11th before falling into a very familiar Bullish Pattern, the Falling Wedge!
The Falling Wedge is typically a Bullish Pattern where we expect Price to give us a Bullish Break of the Falling Resistance and Successful Retest of the Break before Price heads Higher!
Wedge Patterns can play both Reversal and Continuation Patterns dependent upon the location they form and surrounding Major Support/Resistance or Highs/Lows. In this case, we will be looking for a Continuation with Price being in an Uptrend before pausing slightly for a Consolidation Phase to form the "Triangle" of the Pattern.
*It is important to note that both the Falling Resistance and Falling Support have only been tested twice where three tests of both Trendlines should point to a strong equilibrium from both Bears and Bulls, validating the legs of the Triangle and strengthening the Consolidation Bias. ( So we could see Price test the Falling Resistance one last time before falling down to the Falling Support for a 3rd test! )
Lastly, when it comes to a Wedge Pattern, we should suspect that once Price makes a 3rd Test of the Falling Support and Retraces to the 50% Fibonacci Level @ .85887, this will signal the End of the Consolidation Phase!
- And this will be the time to enter!
**Once the Pattern is Confirmed and Breakout is Validated, based on the "Flagpole" or Rally prior to Price falling into the Consolidation Phase we can anticipate Price to potentially rise to the most recent High on April 11th of .87374 and give the next Previous High on November 16th 2023 of .87657 a try!
Fundamentally, news is light this week for both currencies in the pair with GDP m/m releasing for GBP on Friday, July 11th with a Forecast of .1%, a .4% increase from June's -.3%
Also, CPI y/y for GBP will be released the following week on Wednesday, July 16th.

Britania Notable Fluctuations In the last few days, Britannia's stock has experienced notable fluctuations, driven by market sentiment and recent earnings reports.
Following a positive outlook from analysts, the stock saw a brief rally, fueled by strong consumer demand and effective cost management strategies.
However, profit-taking and broader market trends led to slight pullbacks.
Overall, the stock remains a focus for investors watching for further developments in the FMCG sector and its ongoing recovery post-pandemic.
Buy at 5869
SL 1:- 5848
SL 2:- 5827
TGT1 :- 5910
TGT2:- 5980

AUDUSD Potential UpsidesHey Traders, in today's trading session we are monitoring AUDUSD for a buying opportunity around 0.64600 zone, AUDUSD is trading in an uptrend and currently is in a correction phase in which it is approaching the trend at 0.64600 support and resistance area.
Trade safe, Joe.

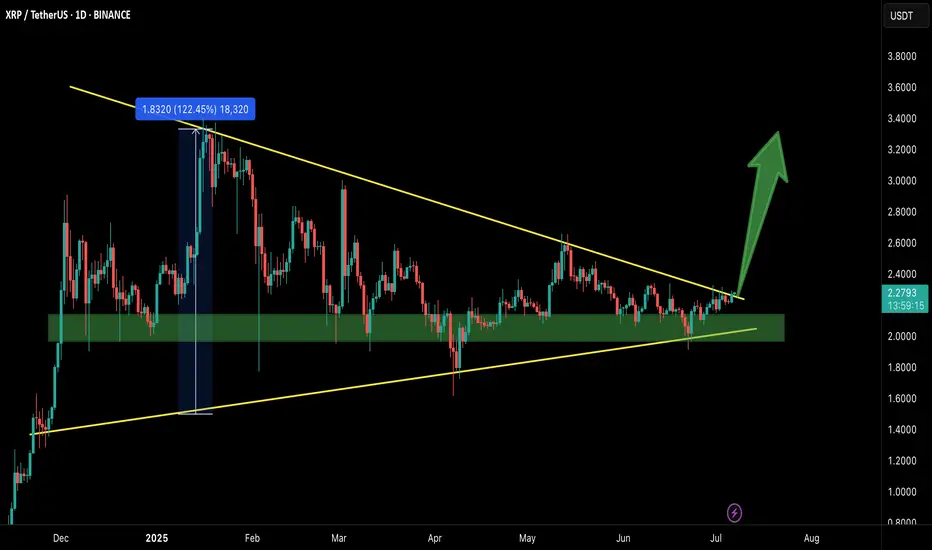
XRP/USDT – Breakout Confirmed!Hey Traders — if you're into high-conviction setups with real momentum, this one’s for you.
XRP has finally broken out from the massive symmetrical triangle on the 1D timeframe after holding the green support zone like a champ.
This structure has been compressing for months, and with this breakout, momentum could be shifting in favor of the bulls.
Entry: Current Market Price (CMP)
Add More: On dips above $2.20
Targets: $2.60 / $2.95 / $3.40 / $3.80
Stop Loss: $2.05
Leverage: 5x–10x
As long as price stays above the breakout zone, this setup holds strong potential. Keep a close eye for volume confirmation and follow-through.
Let’s see how this plays out. Will update as it unfolds.
GOLD BEST PLACE TO BUY FROM|LONG
GOLD SIGNAL
Trade Direction: long
Entry Level: 3,312.57
Target Level: 3,353.45
Stop Loss: 3,285.24
RISK PROFILE
Risk level: medium
Suggested risk: 1%
Timeframe: 4h
Disclosure: I am part of Trade Nation's Influencer program and receive a monthly fee for using their TradingView charts in my analysis.
✅LIKE AND COMMENT MY IDEAS✅

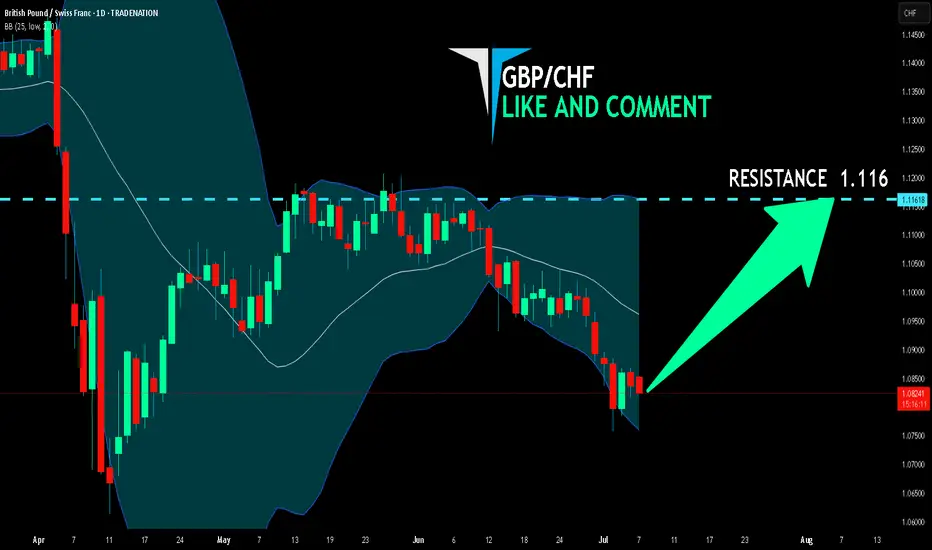
GBP/CHF LONG FROM SUPPORT
Hello, Friends!
GBP/CHF pair is in the downtrend because previous week’s candle is red, while the price is obviously falling on the 1D timeframe. And after the retest of the support line below I believe we will see a move up towards the target above at 1.116 because the pair oversold due to its proximity to the lower BB band and a bullish correction is likely.
Disclosure: I am part of Trade Nation's Influencer program and receive a monthly fee for using their TradingView charts in my analysis.
✅LIKE AND COMMENT MY IDEAS✅
Will The new Week kick off more bullish Pressure for GOLD?looking for more bullish activity this week but need to sit on my hands for now to see if they establish a Low for the week first. Once we see that and start to see HH's made then we can consider a entry to get in on the move. I cant rush it though. Have to be patient.

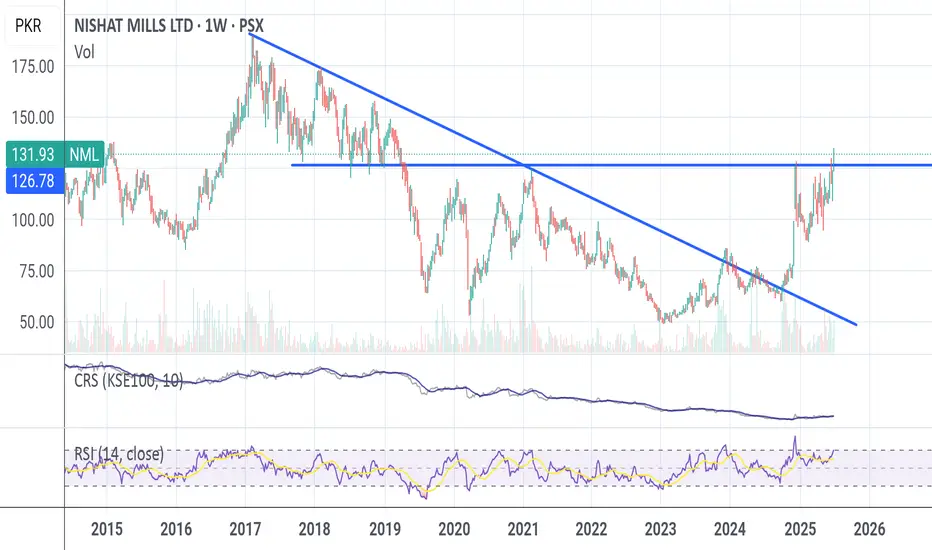
NMLStarting to move high from key polarity zone. Just like other textile companies, this one also looks good.
NG1! SENDS CLEAR BULLISH SIGNALS|LONG
NG1! SIGNAL
Trade Direction: long
Entry Level: 3.387
Target Level: 3.635
Stop Loss: 3.222
RISK PROFILE
Risk level: medium
Suggested risk: 1%
Timeframe: 9h
Disclosure: I am part of Trade Nation's Influencer program and receive a monthly fee for using their TradingView charts in my analysis.
✅LIKE AND COMMENT MY IDEAS✅

$SNAP -- accumulation $8 into $9. big move brewing into earningsHello, extensive chart here: Daily and Weekly. Looking at this name I like the setup here. The Daily and Weekly chart shows strength in this area, $8 to $9 with heavy accumulation and support. The Weekly chart shows about 13 weeks of this bottoming area with tons of buying from previous years as well. NYSE:SNAP has earnings July 25th and I will be looking to enter $10 calls with a date of 8/15. The premiums could spike just into earnings since it is a popular name to play around that time and it has plenty of daily volume. The SMA and EMA on the weekly honestly is my target -- it is a big sell zone. We are in the liquidity area and have been. Will be starting a position on these contracts this coming week. This name should see $10 with relative strength but my first target is mid $12 before earnings. I would like to shed some contracts into the earnings date and see if we can make an extra buck or two on profited contracts so when earnings comes it can be a risk free stress free play.
WSL.

GBPJPY Breakout and Potential RetraceHey Traders, in the coming week we are monitoring GBPJPY for a buying opportunity around 196.600 zone, GBPJPY was trading in a downtrend and successfully managed to break it out. Currently is in a correction phase in which it is approaching the retrace area at 196.600 support and resistance zone.
Trade safe, Joe.

GOLD 1H – Breakout Retest or a Fragile Bullish Hope?👆🚀Boost it if you like it... (Thank you) 🚀👆
Gold has finally broken out above the descending trendline that has capped price for weeks. We’ve already seen Leg 1, an impulsive rally from the strong support zone, and a textbook retest of the broken trendline.
If bulls hold this level, a Leg 2 continuation could unfold.
Key Factors to Watch:
✅ Strong demand zone fueling the first leg up
✅ Clean breakout and retest of descending resistance
✅ Price still hovering around EMAs (15/60)
⚠️ However, the structure is fragile – lack of follow-through could trap late buyers
⚠️ If price loses the retest area decisively, sellers may reclaim control
Trading Insight:
This is a fascinating setup for bulls—but don’t fall in love with it. Stay adaptive. The market doesn’t owe us a second leg higher. Manage risk carefully and remember: probabilities, not certainties.
Trade Safely...
#MJTrading
#Gold #XAUUSD #TradingView #TechnicalAnalysis #BreakoutTrading #SupportResistance #PriceAction

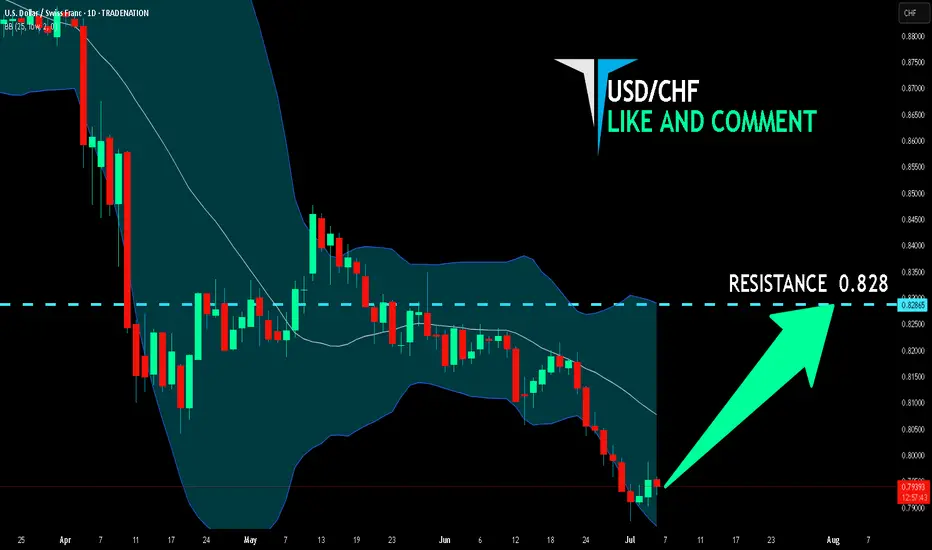
USD/CHF BULLS WILL DOMINATE THE MARKET|LONG
Hello, Friends!
Bullish trend on USD/CHF, defined by the green colour of the last week candle combined with the fact the pair is oversold based on the BB lower band proximity, makes me expect a bullish rebound from the support line below and a retest of the local target above at 0.828.
Disclosure: I am part of Trade Nation's Influencer program and receive a monthly fee for using their TradingView charts in my analysis.
✅LIKE AND COMMENT MY IDEAS✅
SEI Long – Breakout with Relative Strength & Trend ContinuationSEI is showing strong relative strength and has just broken out of recent structure. We’re watching for a higher low to form above the $0.22 zone, confirming trend continuation and unlocking upside liquidity.
📌 Trade Setup:
• Entry Zone: Around $0.22
• Take Profit Targets:
o 🥇 $0.29
o 🥈 $0.39
o 🥉 $0.49
• Stop Loss: Daily close below $0.19

AUDUSD Potential UpsidesHey Traders, in today's trading session we are monitoring AUDUSD for a buying opportunity around 0.65500 zone, AUDUSD is trading in an uptrend and currently is in a correction phase in which it is approaching the trend at 0.65500 support and resistance area.
Trade safe, Joe.

INJ Long Swing Setup – Structural Recovery with SMA ReclaimINJ has retraced to a key support zone and is showing early signs of recovery, reclaiming its 20-day SMA. With structural strength returning, the $11.00–$11.60 range offers a solid swing entry—contingent on BTC holding key levels.
📌 Trade Setup:
• Entry Zone: $11.00 – $11.60
• Take Profit Targets:
o 🥇 $14.00 – $16.00
o 🥈 $19.80 – $23.00
• Stop Loss: Daily close below $9.50 (Exit early if BTC breaks major support)

INJ - Back from the Dead?Hello TradingView Family / Fellow Traders. This is Richard, also known as theSignalyst.
INJ has been hovering within a wide range between our two green zones, spanning from $10 to $16.
For the bulls to take control in the medium term, a break above the last major high marked in blue is needed.
To confirm long-term bullish dominance, a breakout above the upper boundary of the green range is required.
📚 Always follow your trading plan regarding entry, risk management, and trade management.
Good luck!
All Strategies Are Good; If Managed Properly!
~Rich
