What Is the Hanging Man Candlestick Pattern: Meaning & Trading?What Is the Hanging Man Candlestick Pattern, and How Can You Trade It?
In the world of technical analysis, candlestick patterns play a vital role in helping traders decipher market trends and potential reversals. Among the many setups, the hanging man holds particular significance. This distinctive formation captures traders' attention as it often serves as a warning sign of a possible trend reversal. This article will go through the technical analysis of the hanging man formation and explain how traders can trade with it.
What Is a Hanging Man Pattern?
The hanging man candlestick pattern is characterised by a small body near the top of the candlestick, a long lower shadow, and little to no upper shadow. It resembles a figure hanging from its head, hence the name "Hanging Man."
Psychology Behind the Hanging Man
The psychology behind the hanging man candlestick pattern reflects a shift in market sentiment. After a sustained uptrend, the appearance of this pattern indicates that buyers are losing momentum. The long lower shadow shows that sellers were able to push prices down significantly during the trading session. Although buyers managed to drive prices back up, the close near the open price suggests weakening bullish sentiment. This pattern signals that selling pressure is increasing, potentially leading to a bearish reversal as confidence among buyers diminishes.
The hanging man is a versatile formation that can be applied across a wide range of financial instruments, including stocks, cryptocurrencies*, ETFs, indices, and forex, on different timeframes.
Identifying a Hanging Man Candlestick on Trading Charts
To spot a hanging man pattern in stocks and other financial instruments, you may follow these key steps:
Look for an existing uptrend: Start by identifying a prevailing upward price movement on the chart.
Locate a candlestick with specific characteristics: Search for a candlestick with a small body near the top, a long lower shadow, and little to no upper shadow. This formation resembles a figure hanging from its head. The colour of the candle doesn’t matter, but if it’s bearish, the signal is stronger.
Consider supporting indicators: Utilise other technical indicators or oscillators to further validate the potential reversal. These can include trendlines, moving averages, or momentum indicators that align with the bearish interpretation.
Note that there is no such thing as an inverted hanging man candlestick or a bullish hanging man candlestick pattern.
Trading the Hanging Man Pattern
Those trading the hanging man reversal pattern need to apply a systematic approach in order to increase the likelihood of successful trades. Here are a few steps traders usually follow to trade this pattern:
- Identification: Identify the setup by using the steps mentioned above.
- Look for confirmation signals: The setup alone is not sufficient for making trading decisions. Seek additional confirmation through subsequent candlestick patterns or technical indicators. This can include bearish candlestick patterns (e.g. bearish engulfing or shooting star), a breach of support levels, or the convergence of other indicators signalling a potential reversal.
- Define your entry point: An entry point can be either when the next candlestick confirms the bearish sentiment or when the price breaches a significant support level.
- Consider risk management: Assess the risk-reward ratio of the trade and ensure it aligns with your risk tolerance. For efficient risk management, you may adjust your position size accordingly. Risk management tools like position sizing, setting stop-loss orders, and diversification may help protect your capital. You may set a stop-loss order above the hanging man pattern to limit potential losses if the trade goes against you.
- Identify profit targets: The candlestick itself doesn't provide specific targets. Traders can identify profit targets by looking at previous support levels, Fibonacci retracement levels, or other technical analysis tools like moving averages or pivot points.
- Monitor the trade: Keep a close eye on your position as it progresses. Pay attention to any changes in market conditions or additional signals that may invalidate the trade.
- Learn from outcomes: Regardless of the outcome of the trade, analyse it afterwards to identify areas for improvement. Assess whether the setup provided accurate signals and identify any factors that may have affected its success. This analysis will help refine your trading strategy over time.
Live Market Example
Consider the example of a hanging man on the forex USDJPY pair. An entry is placed on the next bearish candlestick with a stop loss just above the hanging man. The take profit order is at the next level of support marked by the orange line.
Limitations of the Hanging Man Candlestick
The hanging man candlestick pattern, while useful, has certain limitations that traders need to consider:
- False Signals: The hanging man can produce false signals, especially in volatile markets where price movements are erratic.
- Market Context: The effectiveness of the pattern varies depending on the broader market context and prevailing trends.
- Timeframe Sensitivity: Its reliability can differ across various timeframes; what works on a daily chart may not be as effective on an intraday chart.
- Not Standalone: It should not be used in isolation but as part of a comprehensive trading strategy that includes other indicators and risk management tools.
Comparing the Hanging Man to Similar Candles
Understanding how the hanging man pattern differs from similar candlestick patterns helps in accurate technical analysis. Here's a brief comparison of the hanging man with related patterns.
What Is the Difference Between a Hanging Man and a Hammer?
Both have the same candle structure. However, the hanging man candlestick occurs in an uptrend and signals a potential bearish reversal, while the hammer occurs in a downtrend, indicating a potential bullish reversal. Interestingly, it is possible to see a hanging man candlestick in a downtrend, often as part of a bullish retracement. Both candles require confirmation from subsequent price movements. They should be analysed within the context of the overall market trend and other technical indicators.
What Is the Difference Between a Pin Bar and a Hanging Man?
A pin bar and a hanging man are both single-candlestick patterns with small bodies and long shadows, but they serve different purposes in technical analysis. The pin bar has a small body and a long tail, indicating a reversal, but it can appear in any market condition. Its long tail shows a strong rejection of a certain price level, with the body pointing in the direction of the anticipated reversal.
The hanging man, however, specifically occurs after an uptrend and signals a potential bearish reversal, characterised by a small body at the top and a long lower shadow, indicating selling pressure.
What Is the Difference Between a Shooting Star and a Hanging Man Candlestick?
The shooting star and the hanging man are both bearish reversal patterns, but they differ in their appearance and context. A shooting star occurs after an uptrend and features a small body at the bottom with a long upper shadow, indicating that the price was pushed up significantly but fell back down, showing strong selling pressure.
The hanging man also appears after an uptrend but has a small body at the top with a long lower shadow, suggesting that sellers dominated the session despite an initial push by buyers. Both require confirmation from subsequent candlesticks to validate the reversal.
Final Thoughts
While the hanging man alone is insufficient for making trading decisions, it serves as a warning signal that buyers may be losing control and that selling pressure could increase. Traders seek additional confirmation through subsequent candlestick patterns, support and resistance levels, and other technical indicators to validate the potential reversal.
By understanding the implications of the setup within the broader market context and employing proper risk management strategies, traders can enhance their decision-making process and improve their chances of identifying different trading opportunities.
FAQ
What Does the Hanging Man Pattern Indicate?
The hanging man trading pattern in technical analysis typically indicates a potential trend reversal in an uptrend. It suggests that the buyers, who have been driving the market higher, are losing control, and the selling pressure may increase.
The hanging man is represented by a small body near the top of the candlestick, a long lower shadow, and little to no upper shadow. It resembles a figure hanging by the neck. This visual representation conveys the potential bearish sentiment.
Can a Hanging Man Candle Be Bullish?
No, there is no such thing as a bullish hanging man candlestick pattern. The bearish hanging man pattern indicates a potential trend reversal from an uptrend to a downtrend.
Is the Hanging Man Pattern Reliable?
The reliability of the formation, like any candlestick pattern, can vary depending on several factors. While the setup is widely recognised and considered a potential bearish reversal signal, it should not be relied upon as the sole basis for trading decisions. It is crucial to consider other factors and confirmation signals to increase its reliability.
What Is the Confirmation Candle for the Hanging Man?
A confirmation candle for the hanging man is a bearish candlestick that follows the pattern, confirming the reversal. This can include a bearish engulfing candle or a candlestick closing well below the hanging man's body, indicating increased selling pressure.
Is the Hanging Man Pattern Bearish?
Yes, it is generally considered a bearish pattern in technical analysis. It is formed when the price’s open or close is near or at its high, there is a significant decline during the trading session, and it closes not far from the opening price. The pattern resembles a hanging man with his legs dangling.
*Important: At FXOpen UK, Cryptocurrency trading via CFDs is only available to our Professional clients. They are not available for trading by Retail clients. To find out more information about how this may affect you, please get in touch with our team.
This article represents the opinion of the Companies operating under the FXOpen brand only. It is not to be construed as an offer, solicitation, or recommendation with respect to products and services provided by the Companies operating under the FXOpen brand, nor is it to be considered financial advice.
Bullishcandle

LONG! Bitcoins hit current support - BTC ready for up trendBTC has confirmed support on the daily, We have alot of market indecision and have had sideways price movement testing our bull market support.
As investors pre [are to liquidate and take up short positions BTC has failed to experience any confirmation, volume.
Without volume to confirm the price direction when the price has fallen below support the Price has recovered on all charts up to daily with backtest
We have the appearance of a Morning star Doji candle on the daily with the body above the star (rising) that should Boost Confidence and get us back above !68k
Watch for the daily close to close above open
I am getting in position with a long currently, and will maintain tight stops but am confident to trade at this level

QI/BTC Inverted Hammer On Monthly TimeframeBullish candle could be signaling a reversal on this pair.

ETHUSDT "H1"Just an easy look. 2 Trend lines. a Bullish candle on bottom of upward trend. Buy high, Sell Higher.
**Please analyse the chart by yourself and do not trade with my analyse.**

Bullish Candle Close ! Here We Go ! FET/BTC #FET $FET #FetchAIGreat news for FET ! After that pullback we've finally closed a candle that breaks above our downward trendline . This looks Bullish -and good to continue up. We will be revisiting that 1550 area again it seems . But will we finally break through it ? It will be our 3rd time now to hit that resistance there . Will we break through it this time ? 3rd time's a charm ! Let's see ! After we break through that 1550 area I would expect us to hit 2000 or so and then go towards our Cup & Handle target near 2890 . Weekly resistance is near 3200 sats and our .236 fib is 3420 . Above that is fib targets which I will link in my chart below from March . Notice we hit a TD Sequential 9 in red going donward but that last Number 9 candle is actually turning green as well as breaking above that trendline ! You can see it where the green arrow is pointing on my chart . That's our turnaround candle ! This looks absolutely good to continue up as well as having great fundamentals and a great team at Fetch AI .

ALPHAUSD AnalysisReasons to sell
Strong resistance level at $1.90 - $2.00 currently being rejected once again with a 4th touch.
Looks like there was a fake-out move around the 23rd-24th March with price breaking out of the strong resistance level previously mentioned.
Weekend (saturday) and nearing end of monthly candle closure where a correction usually happens
Reasons to buy
Strong daily candle close the day before on the Friday (same day as options expiry)
Options expired so selling pressure has gone
Still testing the Strong resistance turned support level at $1.81

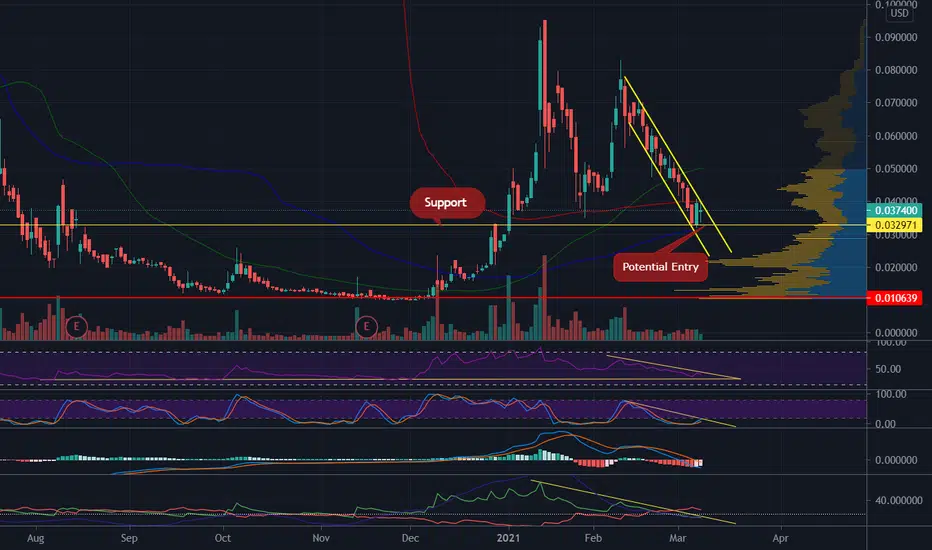
$TLSS Descending Channel - Potential EntryReviewing the daily looks like it has found support with a potential reversal in play
LTCUSD At The UTL With Bullish Engulfing CSFLitecoin looks almost identical to Ethereum,its at the up trendline with a bullish engulfing candlestick formation.
go back to my ETHUSD post to see more in depth why I like this setup

I AM BACK / BITCOINI am back friends ;)
I want to share my opinion ,
BTC oversold.
Trens still bullish.
Probably inversion candle to new high !!
Stay tuned much more ideas coming soon ;)
Share with friends trader and follow me ;)

Bitcoin USD Entry Review As described on the previous idea Bitcoin has hitted a strong support level.
Here is a example what it would of been a great entry.
On the 1 hour TF the market had given us a Bullish Engulfing candlestick formation with a increase in volume and after that the market went up.
Alway wait for the right entry.
Here it was:
1) Bullish Candlestick Formation
2) Increase In Volume
3) Daily Support


DKS - Hammer pattern reaching supportMay 2nd: DKS reached SMA(100) support line forming a Hammer candlestick.
Technical information:
RSI(14) @39
CCI(10) @-100
Support: 32.46
Resistance: 39.4

