Top 4 Buy Signals Lighting Up Mastercard (MA) 🚀 Top 4 Buy Signals Lighting Up Mastercard (MA) | Rocket Booster Strategy
Mastercard Inc. (MA) is showing explosive potential, and it’s not just one signal—it’s a whole confluence of confirmations. When
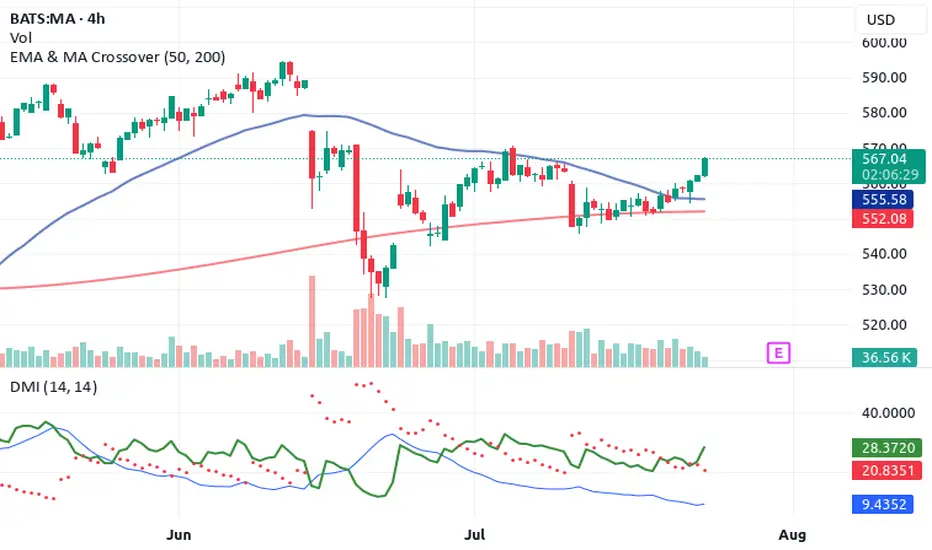
you align this much market momentum, you don’t ignore it. Let’s break down how Rocket Booster Strategy gives us a powerful buy indication on the daily chart.
🔍 The Confluence Setup
✅ 1. DMI Buy Signal
The Directional Movement Index (DMI) is in bull mode. ADX is
rising and the +DI is firmly above -DI. This shows the trend is not just alive—it’s gaining strength.
🔻 2. Volume Oscillator Pullback
While Volume Oscillator is down, this is seen as constructive and not bearish. It suggests a quiet zone before the thrust—just like fuel loading before a rocket launch.
Smart traders know: momentum can build silently.
💥 3. Awesome Oscillator = Strong Buy
The Awesome Oscillator is green and firing hard. We’ve seen a clear twin-peak bullish formation followed by a break above zero
—classic acceleration sign.
🕯️ 4. Rising Window (Japanese Candlestick Pattern)
A Rising Window—a bullish continuation gap—has formed. This is one of Steve Nison’s top continuation patterns. It signals strong
institutional conviction in this trend.
📈 What Does This Mean?
When DMI, AO, candlestick patterns, and our own Rocket Booster Strategy all point up, it’s time to pay attention. This setup is rare—and high-probability.
🧠 Rocket Booster Strategy Recap
This strategy uses 3 momentum alignment points:
High Momentum Indicator (like AO) in Buy Mode
Pattern Confirmation (Rising Window or Engulfing)
Volume Correction Before Breakout (Fuel Before Fire)
When all 3 click into place, we have ignition.
🎯 Final Thoughts
Mastercard is looking primed for takeoff on the daily timeframe. Whether you’re an investor or a swing trader, this chart is
speaking loud and clear. But as always, risk management is your co-pilot.
✅ Add it to your watchlist.
🚀 Simulate entries.
🧠 Trust the confluence.
Rocket Boost This Content To Learn More
Disclaimer: This is not financial advice. Always use a simulation/demo account before committing real capital. Trade responsibly.
Bullishconfluence
Btc about to hit smaller double bottom breakout target.I’m sure this chart looks like a mess to most of you but every line currently on the chart is part of a pattern that is currently in play. We can see the smaller double bottom pattern we have been above the neckline of for a few days has a breakout target of 47.7k which it appears we are currently heading to now. In doing so, price action has also hoisted itself above the neckline of another larger double bottom (top green horizontal) and if it can hold support on that neckline the breakout target for the larger double bottom is around 54k! 54k also happens to be the same breakout target zone for the falling wedge(not shown here) that we broke up from back in January or February and had been charting since last December…so its nice to see that sort of bullish confluence. We are also finally seeing price action considerably above our tan rising wedge here which is a good sign especially if we can maintain its top trendline as support. The smaller double bottom’s breakout target of 47.7k takes us right up to the top trendline of our rising channel (in purple) so it would not be unexpected if we see that line maintain resistance at first. I imagine we may send a wick above it to test the 200ma and initially see a rejection that sends price action back down to retest the larger double bottoms neckline for support, at which time I’m guessing the bigger dbl bttm’s neckline will hold support and once it confirms its breakout is when we will finally break above the purple rising channel as well as the 200ma (in blue). We shall see though because we always have to anticipate an unexpected black swan event could send us 180 degrees the opposite way as well. For nw though, the charts are lookin super bullish. *not financial advice*

EURGBP Long Setup - 4hr Breakout EURGBP can be construed to be in a continuation of its long term uptrend with a dispersal triangle pattern on the daily. If this is the case we are due a move back up to the uptrend and a breakout of this shorter term downtrend shown on the chart.
As we are approaching the lower positive trend we are getting ever closer to a long opportunity where we will be targeting the level shown on the chart at TP1. We also have some bullish divergence to suggest a breakout move is on the cards.
EURGBP has a strong bullish sentiment over the last few months helped not least by news events and subsequent predictions that the European currency is due to reach 1:1 with the pound as British uncertainty continues. Buy.

GBPCAD Long: Bullish Confluence with High R/RGBPCAD has completed a bullish bat on the 15m TF. Zooming out to 1HR we can observe a double bottom forming at the PRZ. Two longer-term trendlines provide added support at this level. The daily TL also forms a potential bottom barrier of a triangle pattern where the first bottom serves as touch four. Targets are placed at structure high and 1.272/1.618 extensions which are confluent with other important levels (see chart for details). SL is placed below recent lows for a R/R of over 18 if support holds. Wait for candle close for another bullish pinbar confirmation before entry for a more risk-averse approach.
Shorter TF Bullish Bat Complete:
Bullish Confluence:
Bullish Bat
Potential double bottom
Daily TL Support
4HR Trendline Support
Potential triangle forming on daily
Bullish pinbars forming indicating buying pressure
