Is OSTK trading in an Ascending Triangle?OSTK's earnings are fast approaching, it'll be interesting to see if there's any bullish momentum from the numbers.
Since early January this year up until today, the blue upward sloping support of the pattern has held forming a series of higher lows & an Ascending Triangle.
On the KST there's a bullish cross where I've placed the blue finger.
The DMI is displaying a bullish twist and indicating potential further momentum to the upside.
Bullishcross

Is CRSP trading in an Ascending Triangle?It appears as though CRSP is potentially bottoming out and forming an Ascending Triangle pattern.
On the DMI there's been a bullish twist where I have placed the blue downward pointing finger.
On the KST there's been a bullish cross where I have placed the blue check mark and upon back-testing the red line we've seen a bullish bounce where another check mark.

Descending Channel for GRAM?It appears as though GRAMF is trading in a descending channel that shows minus the minor deviation where the price breached the support but quickly went back into the channel where I've placed the blue sideways finger.
On the DMI there has been a bullish twist where I've placed the green downward pointing finger.
On the KST there has also been a bullish cross where I've placed the green downward pointing finger.

Fake-out of an Ascending Triangle for BTC?It appears as though Bitcoin has pulled a fake-out to the upside of an ascending triangle but has found support on the blue upward sloping support of the pattern..
On the RSI there's clearly a lower high after lower high since BTC reached ATH's forming a descending triangle pattern, but the downward sloping resistance is on the verge of being breached to the upside.
On the KST there's a bullish cross where I've placed the blue downward pointing finger.
Every time BTC has broken the horizontal resistance to the upside there has been a swift rejection by the bears.
I have placed red downward pointing fingers displaying how often this has taken place to put things into perspective.

Descending Channel for TNY?!?!TNY appears to be trading in a descending channel on a micro-level.
Descending channel patterns are short-term bearish in that a stock moves lower within a descending channel, but they often form within longer-term uptrends as continuation patterns. The descending channel pattern is often followed by higher prices, but only after an upside penetration of the upper trend line.
On the KST there has been a bullish cross where I've placed the green downward pointing finger.
On the RSI the downward sloping resistance of a descending triangle pattern is being negated, very bullish and it's possible the price will breach the blue downward sloping resistance of the descending channel to the upside if Tinley can release some note-worthy news next week, don't hold your breath.
A breakout to the upside means there's a shift from bearish sentiment to bullish. It’s recommended that buying into this break should occur after multiple tests of the upper channel line. The reason being breakouts early on in the channel often lead to traps as shorts push the price of the stock back down to the lower end of the channel.

Ascending Triangle for Bitcoin??It appears as though BTC is breaking the horizontal resistance of an Ascending Triangle.
On the KST there's been a bullish cross where I've placed the blue upward pointing finger.
The RSI is fairly overextended, but this doesn't mean it won't stay that way for multiple trading days or weeks.
I've placed multiple green fingers on the RSI that correlate to the price indicating with BTC there can be sideways and often downward movement on the RSI while the price continues it's upward momentum.

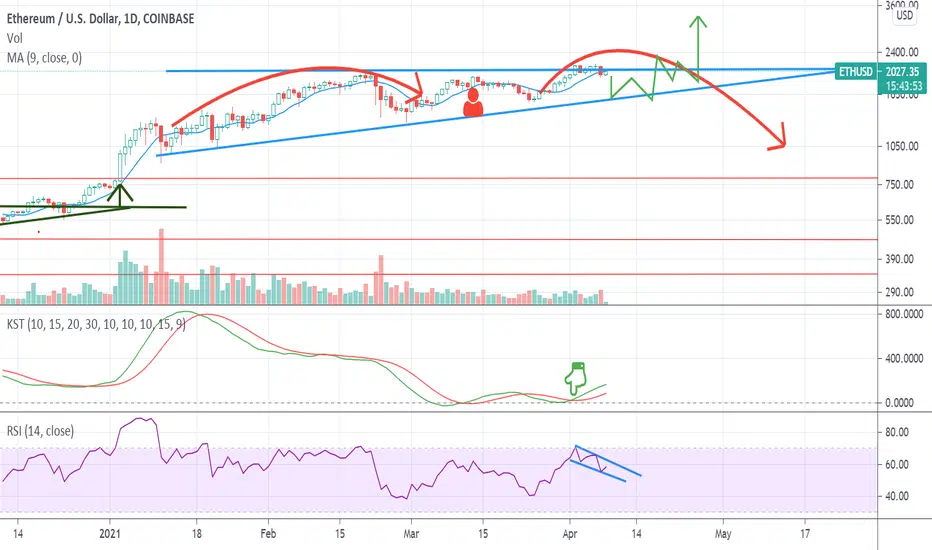
Ascending Triangle for Ethereum?ETH appears to be trading in a giant Ascending Triangle.
There's potential merit for an H&S forming.
In a few more trading days we'll see if there will be a re-test of the blue upward sloping support of the Ascending Triangle before a blue sky breakout of the bullish formation.
On the KST there's a bullish cross where I've placed the downward pointing finger.
Is HIVE about to breakout of a Bull Flag?It appears as though Hive is slightly breaching the downward sloping resistance of a Bull Flag, recently there was another fake-out to the downside of the horizontal baseline of support but the sp has created a higher low on top of the rising channel for a second time where I have placed the blue fingers.
The RSI is already breaching the downward sloping resistance of a similar pattern.
On the KST there has been a bullish cross, you need to zoom in close to get a clear view.
The chart linked to this chart displays a slightly different narrative, it displays the sp is trading inside the rising channel on the verge of breaking out to the upside.

ZCash is on the verge of breaking out of an Ascending Triangle.Zcash is the one coin I don't want to chart about, I'd like it to stay cheap for a few years to accumulate, lmao.
It appears as though Zcash is about to break the red horizontal resistance of the pattern, and if not the green upward sloping support will need to hold for any validity of the pattern. Unless there's a fake-out to the downside.
On the RSI there is an Ascending Triangle pattern similar to the price, there's a series of higher lows and moderately higher highs at the horizontal resistance of the pattern. The horizontal resistance dates back into February and probably longer if I charted a longer time frame, it's possible Zcash sees some rejection.
If there is some strong resistance at the horizontal area of the pattern I have drawn a hypothetical scenario in blue.
The KST is displaying a bullish cross where I have placed the blue downward-sloping finger.

Micro Ascending Triangle for Bitcoin?It appears as though Bitcoin is forming a micro ascending triangle after recently breaking out to the upside of a similar pattern in green.
On the RSI there's a series of higher lows forming an ascending triangle, but the previous two lows are right on the upward sloping support of the pattern and are close to being considered lower lows.
On the KST there is a bullish cross where I've placed the blue downward-sloping finger.

Is Hive trading in a Bullish Flag?Since my previous post on Hive linked to this chart, the share price has broken flush to the upside of an Ascending Channel, and upon back-testing old resistance there's been a double bottom where I have placed two blue finger icons, and old resistance has turned into new support forming a bullish flag upon consolidating, inherently bullish in my opinion.
On the RSI there's a similar pattern to the price action.
The KST has seen a bullish cross where I have placed the blue downward-sloping finger, and I've placed a question mark at an area where it's likely another bullish cross will occur near term, depending on the macro environment for Ethereum & Bitcoin.
The pattern could always play out bearishly as a descending triangle, if there's a loss of support at the upward sloping channel area that has acted as the baseline support of the bullish flag then my narrative will adjust accordingly.
If the bull flag pattern were to lose support, I'd expect the next area of support around the bottom part of the upward sloping channel, similar to the path I have drawn in red on the chart.

Fake-out to the downside of a Bullish Flag for Hive?It appears as though Hive has pulled a fake-out to the downside of a bullish flag & re-tested the top of a rising channel turning it into new support.
Hive is now trading back into the bull flag & on the verge of breaking out to the upside any day now considering the price of Ethereum & Bitcoin is continuing to rise and Hive's share price has been highly correlated to the price of these two assets.
BTC is the dark yellow line on the chart.
ETH is the dark orange line on the chart.
The correlation is undeniable and on a longer-term time frame Hive's stock is outperforming both assets which is a perk for being the most profitable public miner and having exposure to both assets, more exposure to Ethereum than BTC but over time that will change as Hive is starting to get more entangled with BTC mining.
On the RSI the downward sloping resistance has been broken to the upside and upon back-testing old resistance, it's acting as support for the time being.
There has been a bullish cross on the KST.
There's been a very nice V shape recovery after this fake-out.

Is Ethereum is about to breakout of an Ascending Triangle?!?ETH is potentially on the verge of breaking out of an Ascending Triangle, BTC has recently broken flush to the upside of a similar pattern linked to this chart.
On the RSI there's a series of higher lows coinciding with the upward sloping support of an Ascending Triangle similar to the price action.
On the KST there's been a bullish cross where I have placed the blue downward-sloping finger.
If there is any retracement look for support at the red line first, if that doesn't hold the upward sloping line of the pattern should act as support again.

Falling Wedge pattern for Ethereum?Ethereum is displaying some bullish momentum, breaking the downward sloping resistance on the RSI flush to the upside out of a bullish flag or descending triangle creating a micro higher high.
On the KST there has been a bullish cross where I have placed the blue downward sloping finger.

Descending Triangle for BTC?!?!Or, potentially this pattern plays out bullishly, there's been a bullish cross on the KST, and whales like to negate patterns frequently with fake-outs in either direction before defining a shift in momentum.
The RSI is forming what could be considered a bullish pennant pattern, recently there's been a series of higher lows, but on the contrary, there have been a series of lower highs for nearly a week coinciding with Bitcoin's ATH's in price.
On the KST there's been a bullish cross where I have placed the blue downward-sloping finger.

Potentially a descending triangle or bullish flag for Gold.Noticeably in blue, there's a descending triangle or bullish flag forming, and similarly, on the RSI there is an identical pattern.
The DMI is displaying a bullish cross where I have placed the blue downward pointing finger.

Ascending Triangle for GRAMF?It appears as though an Ascending Triangle pattern is forming for GRAMF.
The RSI has broken a bullish flag pattern, the downward sloping resistance was pretty consistent until recently, giving the impression of a descending triangle that's now been negated.
On the DMI there has been a bullish cross.

Rising Wedge / Ascending Channel for Ethereum?It appears as though Ethereum is trading in in an Ascending Channel or possibly a Rising Wedge, the price is staying inside the channel except for one deviation that was very short-lived, I'd disregard that price movement because the overall pattern is more important.
I have placed a blue human head and body icon to represent the head of an inverted H&S pattern.
On the RSI there's possibly an Ascending Triangle forming.
On the DMI there's been a bullish cross where I have placed the blue finger icon.

Rising Wedge / Ascending Channel for Bitcoin?It appears as though Bitcoin is trading in a rising wedge or an Ascending Channel with multiple noticeable support and resistance touch points at the top and bottom of the pattern.
On a smaller time frame, there's potentially an Inverted H&S forming, the green human head and body icon is the head of the pattern.
On the DMI there has been a bullish cross.
It would be ideal if Bitcoin can hold the top area of the pattern and flip this resistance into support.

Ascending Channel for Hive?If Hive breakouts of the channel to the upside it would indicate that the price will rally further, and on the contrary, if it breaks below it could indicate further downside price movement.
On the RSI there has been a series of higher lows since late January this year, and the higher lows started occurring coinciding with the price bouncing off the bottom of the channel, potentially forming an Ascending Triangle pattern on the RSI.
On the DMI there have been two bullish crosses where I've placed the green finger icons.

Ascending Triangle breakout for TNY?TNY has found bullish support at the blue upward sloping line multiple times since April 2020, potentially forming an Ascending Triangle.
On the RSI we see a similar pattern as the price, there was a little fake-out that occurred recently but disregard that deviation.
On the DMI there's been a bullish cross.
Also, worth noting, the red downward sloping resistance that has rejected the share price consistently since Aug 2018, was broken to the upside in June 2020, and every time it's been back-tested since it has acted as support, turning old resistance into new support, inherently bullish.
One co-packing announcement or large Beckett's purchase order through Costco, Kroger/Ralphs, or BevMo! should break this ascending triangle pattern flush to the upside, time will tell.
Possibly an inverted H&S in green, with the human body icon being the head.

Is GME trading in another GIANT Ascending Triangle???It appears as though another Ascending Triangle is forming for GME, notice the series of higher lows at the upward green sloping line of support, it's interesting to see a bounce off of the old resistance of the previous Ascending Triangle in blue, inherently bullish.
There's merit for an inverted H&S pattern as well, the green human icon is the head of the pattern.
The RSI is displaying higher lows coinciding with the price action, and there's noticeably a bearish divergence that started Jan 25th, 2021. There has been a slight deviation where I've placed the blue sideways pointing finger, but their downward sloping resistance creating a series of lower highs has been pretty accurate, despite the price increase and choppy sideways price movement. The RSI has cooled off a little potentially indicating further upside action....
On the KST it's pretty neutral and I wouldn't be surprised to see a bullish cross next week where I've placed the blue finger.

Ascending Triangle for GME?Wow, it's nice to see some short-sellers get roasted, bulls get money, bears get money, and pigs get slaughtered.
GME appears to be trading in a GIANT ascending triangle, notice on the RSI there has been a lower high creation for the third consecutive time since January 22nd, but the share price increased and now may be forming a bearish divergence inside of a descending triangle formation.
On the KST there's been a bullish cross, nice!
