SPY: Bullish Deep Gartley with Bullish DivergenceThe RSI on the SPY has Double Bottomed while confirming a Bullish Divergence as the SPY was testing the PCZ of a Bullish Deep Gartley, in addition to the RSI Divergence, the MACD has also confirmed Bullish Divergence and it would seem that the SPY may make its way up to the 100% - 161.8% retraces in the coming sessions.
Bullishdeepgartley

Navigating Bullish Trends Amidst Retracement SignalsUSDJPY is currently demonstrating a Bullish Trend .
For traders preferring long positions, the Bullish Deep Gartley Pattern on the 4-hourly chart might serve as an attractive opportunity for going long.
As part of the strategy, waiting for the market to retest the support level on the 1-hourly chart at 149.26 before entering could be a wise move.
Each trader may have a different approach or perspective based on their analysis and risk appetite.
Feel free to share your trade plan or insights on how you intend to approach USDJPY!

VIX: Bullish Deep Gartley with RSI Bullish DivergenceThe S&P Volatility Index has made its way back down and formed a potential Bullish Deep Gartley on the way down. It is slightly diverging on the intraday at this PCZ and is sitting at the 200-Day SMA. If it were to stage a bounce this week, it would be from here and it would likely have a Bullish Target of $22-$25

BB: Is at the PCZ of a Bullish Gartley and a Bullish Deep CrabBlackBerry is attempting a spring-and-back-test-of-spring at the bottom of the range that it's been trading within since 2012, and the level happens to align with the PCZ of a huge Bullish Deep on the left, to which it has reacted once before, and on its way to testing the zone a second time and back testing the spring. It's also formed a smaller, more localized Bullish Deep Gartley with some hidden Bullish Divergence on the MACD. If it manages to get back above $5 and stay above $5 in the active session, we would then have room to see it pump all the way up to $24.89 really fast as that is the next major level above and near the 200-Month SMA, but if things really want to get serious, we could see BB complete a Full Measured move of this range which would take it all the way up to the 50% retrace up at around $45.39

USDT.D: Bullish Deep Gartley HOP Level with PPO Confirmation 15mWe are about to be getting a 15 Minute PPO confirmation at the HOP Level of this Bullish Deep Gartley as of the time of me writing this and I have added to my Bearish BTC Position.

NLST: Bullish Deep Gartley PCZ at 200 Moving AverageNLST has pulled back to its support trend line and 200 Simple Moving Average which all happens to align with a Bullish Deep Gartley PCZ and it is currently Diverging on Both MACD and RSI and could be getting ready to more than double in value from here.

Combo Trade with RiskThis trading setup provides 1 of the Best Profit Factor. But because of how the candlesticks interact on the PRZ(rectangle box) it is also the most dangerous trading setup.
On the 8-range bar chart, there's a Deep Gartley Pattern setup, and on the 4-hourly chart, a Bat Pattern setup.
Both setups is now resting at X.
If you are new to trading, avoid this trade. If you have not traded Oil before, reduce your position sizing by at least 5x.
It is better to missed a trade than to enter a trade you shouldn't have.

QTUMUSD: Bullish Deep Gartley PCZ Near 200 Day SMA and 0.618QTUM is sitting at PCZ of a Bullish Deep Gartley it's formed locally near the 200 Day Moving Average and the overall range low to high log scale 0.618 where it may try to rally from to later attempt a break of the trendline and then going for new highs.

US Bancorp: Bullish Deep Gartley Piercing LineNYSE:USB is showing a big amount of Bullish Divergence on the Daily after printing a Bullish Abandoned Baby on the 1 Day Chart and a Piercing Line on the 2 Day Chart at the 0.886 PCZ of a Bullish Deep Gartley. If we hold above the lows it could eventually come back up to see 45-55 Dollars.

NOKIA: Bullish Deep Gartley Visible on the Daily.There's not much to go off of other than the Deep Gartley, but I like the area it's at and it looks like the perfect spot to try to catch a bigger move up after having what could be seen as an overly negative reaction to a slight miss on the earnings report.

VUZI: Bullish Gartley/Bullish Dragon w/Weekly Bullish DivergenceVUZI has Double Bottomed on the Weekly Timeframe at the PCZ of a Bullish Deep Gartley and is now attempting a Break-Hook-and-Go off the Spine of a Bullish Dragon it's formed at these levels while showing MACD Bullish Divergence. It would be ideal for VUZI to hold these levels and eventually break back above the 0.886 and to confirm it as support as well before taking off.

TWTUSD: Logscale Bullish Deep Gartley PCZ at Channel Demand LineTWT is currently trading at the PCZ of a Logscale Bullish Deep Gartley which also happens to align with the Demand Line of the Equidistant Channel while showing MACD Hidden Bullish Divergence. I think we could see it push up to the Heartline of the Channel from here but if it gets really crazy maybe it will even push all the way up towards the top of the channel.

Combo Trade, Buying OpportunityA combo trade, a buying opportunity on USDCAD should Point C reaches the highest retracement point on the 1-hourly chart(left). This is a great trading setup because the entry price coincides with the 1-hourly chart(right) Type2 Bullish Bat Pattern at 1.3678.

A 711pips of profits that could be yoursA 711pips of profits could be yours if you join our Weekly Wednesday LIVE Streaming Session on TradingView. Should you ask me my view on EURJPY and choose to engage the Bullish Deep Gartley Pattern at 138.17?
What happens next could be of better use to you, a Potential Bearish Flag Pattern trading setup.
There are 2 ways I would engage it.
The first way is to wait for a break and close below the current trendline, and I'll wait for a retest before engaging the trade.
Another way would require the market to rebound and pause on the higher trendline. That is when I will wait for a candlestick pattern confirmation before engaging the trade.

$GME: Bullish Deep Gartley Trade Idea Remains ValidEarlier, GME hit the Stoploss level of the Previous Chart Idea, but it did not make a new low and has since gone back to the 0.886 PCZ level and is making a Second Level of MACD Bullish Divergence as a result. Due to these factors I think that this Bullish trade Idea is still alive and upon zooming out I can see that this could be a more Macro Double Bottom that could set us up for a Bullish Dragon Breakout in the coming weeks. If we break above the trend line we could see a rally to the 0.618 retracement, which would be a doubling of the current price.

$GME: Perfect Bullish Deep Gartley on the DailyGME may be setting up for a rally towards the $20 area as It's recently broken out of a long term up trending channel but has formed this nice looking Bullish Deep Gartley that could send it up to atleasat backtest the channel or the moving averages as resistance.

Bullish Gartley Pattern at XBullish Gartley Pattern at X is a trading setup that most Harmonic Patterns Traders won't be taking. I'm waiting for a retest at 0.9050 in waiting for a buying opportunity.
The retest will have the Bullish Shark Pattern form up on the first time on the 1-hourly chart. A perfect setup for a Combo Trade Trading Management.

ANCUSD: Volume Spikes into a Bullish Deep Gartley 0.886 PCZWe've had alot of bearish volume come in to attack the PCZ of this Deep Gartley the last few days but yesterday we closed above the 0.886 with more volume than the previous 5 days of declining bearish volume and Bullishly Engulfed the previous day's price action. As a result i will be expecting to see ANC become a bullish outperformer in the near future.

Very interesting setup on USDCADThis is a very unique situation, where both Weekly and Daily Chart's Point X points to the same potential Bullish Deep Gartley Pattern at X and the 4-Hourly and 1-hourly chart had the same Point X for the Bearish Shark Pattern setup. I'm waiting to engage the Shark Pattern 🦈 and the potential completion point is at 1.3447. Candlestick Pattern confirmation is required.
When it happens, I will be using trading management to "upsize" the trade.

GBPAUD - Bullish Deep GartleyA Bullish Deep Gartley form on the intra-day timeframe chart that gives traders a trend trading opportunity for the higher timeframe on both the 1hourly chart and 4-hourly chart.

GBPUSD-Weekly Market Analysis-Nov22,Wk5The overall trend on GBPUSD is heading towards the upside, a bullish trend if that makes more sense to you.
I'm waiting for a buying opportunity. on a Bullish Deep Gartley Patterns that complete at X, I'm aware that most harmonic patterns traders don't trade Gartley Pattern the way I did, but I have other filters in place, and I've been trading harmonic patterns for the past 11 years.

EURUSD-Weekly Market Analysis-Oct22,Wk2If you had read my overall analysis(check out the Related Ideas within TradingView) on EURUSD, you might get a bit confused with this analysis. How could we look for a buying opportunity where the overall trend is bearish? In fact, we can, there are ebbs and flows of the market, so within the bearish trend, there are bullish movements within; what is important is that you have to know if you are trading with or against the trend.
This Deep Bullish Gartley Pattern has been violated, there is a break and close below of X, but with NFP(Non-Farm Payroll) just happening last Friday, I like to give EURUSD some leeway(but leaning towards not engaging it.
Some of the further movement I need to see is an immediate reversal( bullish ) with a double bottom combined with RSI Divergence.

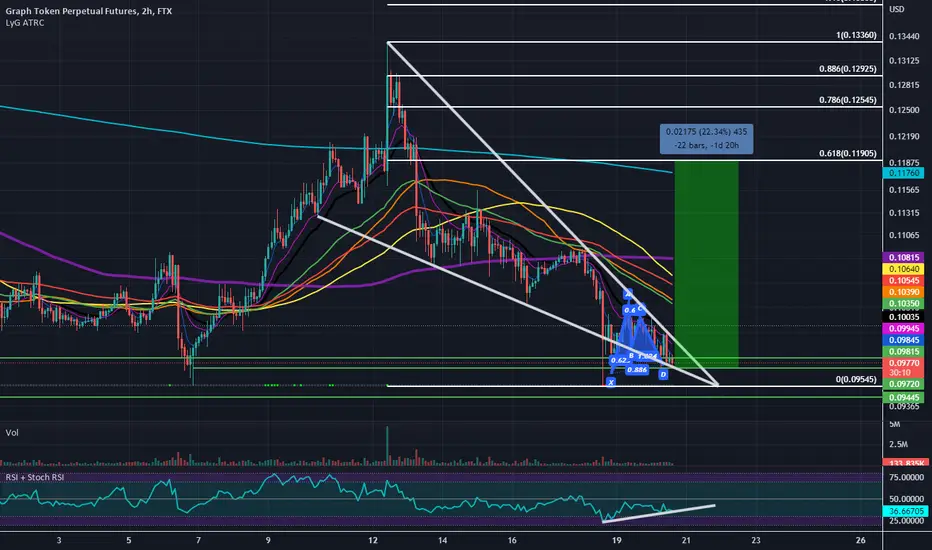
Falling Wedge With Bullish Divergence and Bullish Deep GartleyWe have a promising looking Falling Wedge Visible on the Hourlies with a small Deep Gartley at the Bottom. My target here will be the .618 retrace and the SL will be below the previous major low to our left.