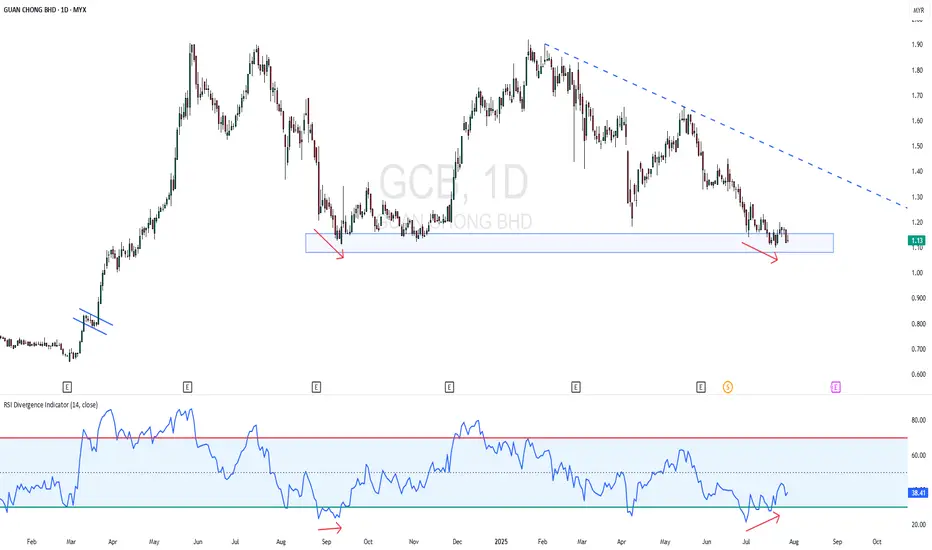
GCB - Near 52 Week LowGCB - CURRENT PRICE : RM1.13
GCB is in a downtrend as the highs and lows both getting low. The stock is near 52 Week Low. However, the stock may rebound higher for short term as there is a bullish divergence in RSI. Price is making lower low while RSI making higher low. Rising in RSI reading indicating there is slightly bullish momentum picking up. Aggressive trader may anticipate for buying with tight stop loss level.
ENTRY PRICE : RM1.13
TARGET : RM1.20 (+6.30%)
SUPPORT : RM1.10 (-2.65)
Bullish Divergence
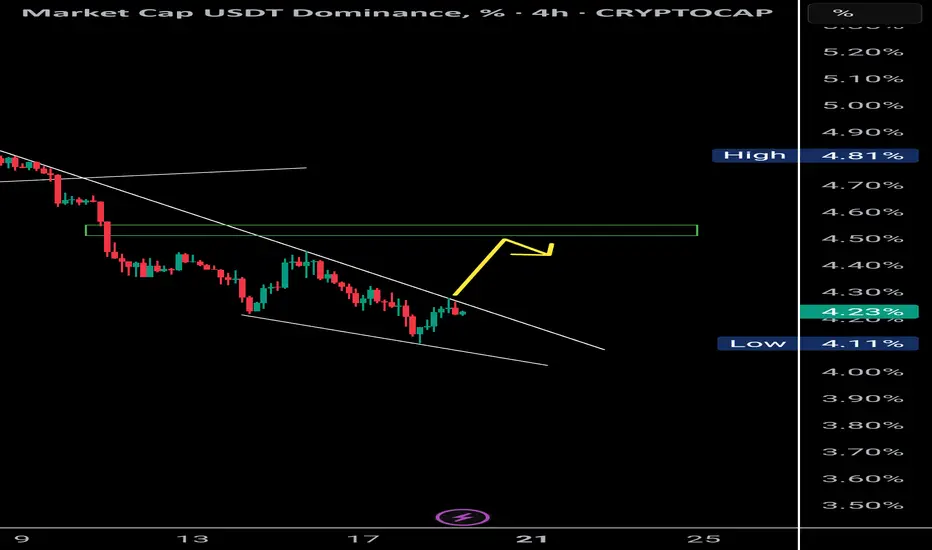
USDT Dominance Forming Bullish Divergence | Altcoins May Retest 📉 USDT Dominance (4H):
Currently forming a bullish divergence with RSI, supported by a falling wedge structure. Price is respecting a clear supply OB (resistance zone) and might retest the 4.55% level.
🔁 Historically, a rise in USDT.D signals short-term corrections in BTC and altcoins, creating opportunities for OB/supply fills and long setups.
📊 This could be the retest phase for major crypto assets before resuming upward momentum.
🧠 Use this phase wisely — it’s where strong setups begin to form.
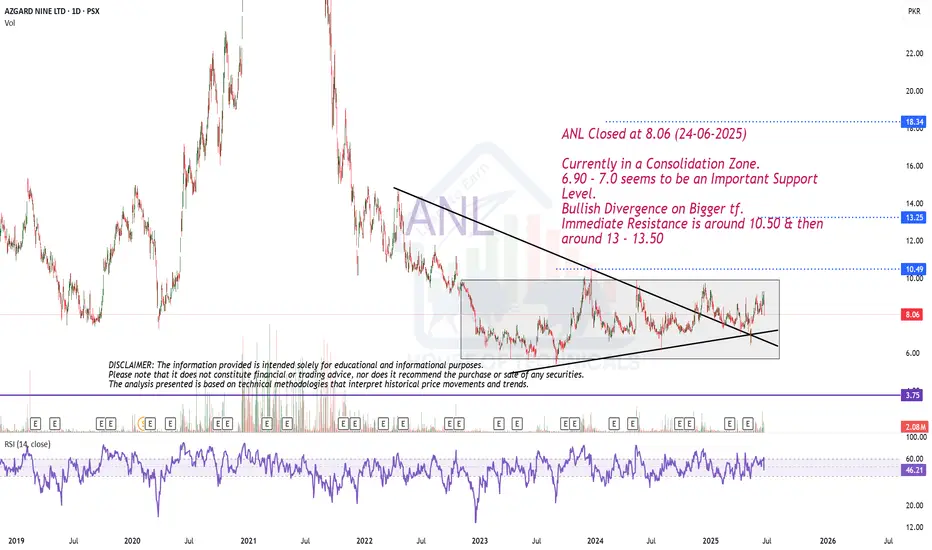
Currently in a Consolidation Zone.ANL Closed at 8.06 (24-06-2025)
Currently in a Consolidation Zone.
6.90 - 7.0 seems to be an Important Support
Level.
Bullish Divergence on Bigger tf.
Immediate Resistance is around 10.50 & then
around 13 - 13.50
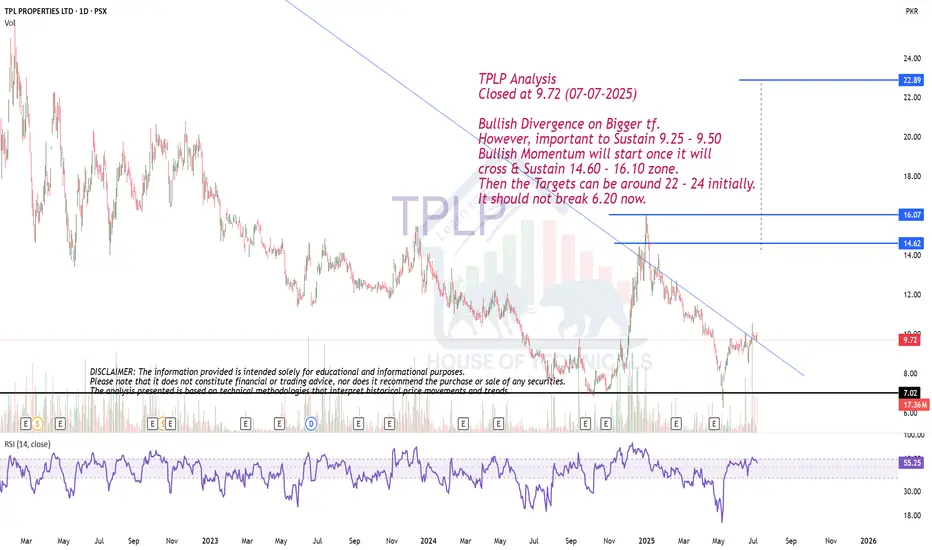
Bullish Divergence on Bigger tf.TPLP Analysis
Closed at 9.72 (07-07-2025)
Bullish Divergence on Bigger tf.
However, important to Sustain 9.25 - 9.50
Bullish Momentum will start once it will
cross & Sustain 14.60 - 16.10 zone.
Then the Targets can be around 22 - 24 initially.
It should not break 6.20 now.
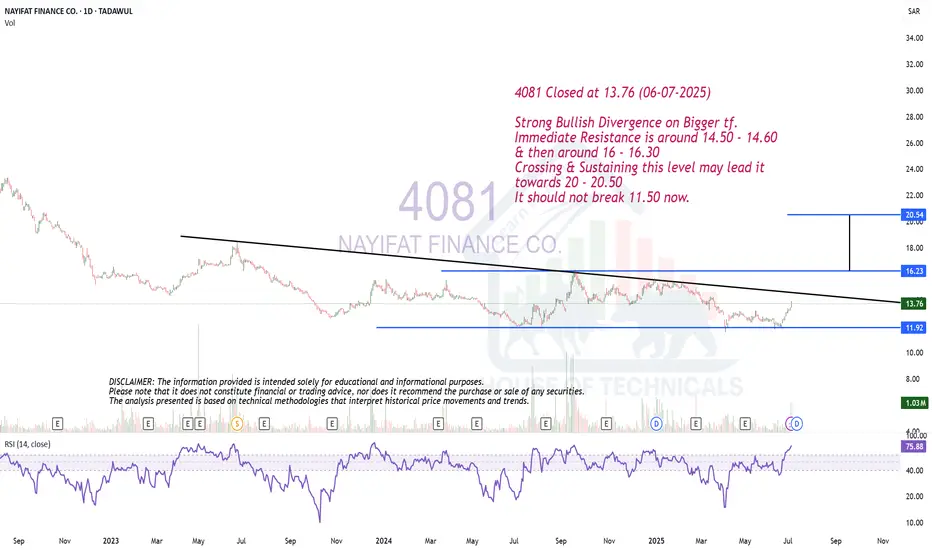
Strong Bullish Divergence on Bigger tf.4081 Closed at 13.76 (06-07-2025)
Strong Bullish Divergence on Bigger tf.
Immediate Resistance is around 14.50 - 14.60
& then around 16 - 16.30
Crossing & Sustaining this level may lead it
towards 20 - 20.50
It should not break 11.50 now.
Double Bottom + Bullish DivergenceDouble Bottom Formation on Weekly basis.
Bullish Divergence appeared.
Crossing & Sustaining 25 may lead it towards 26 - 27
& then around 33 - 34.
However, it should not break 21.90

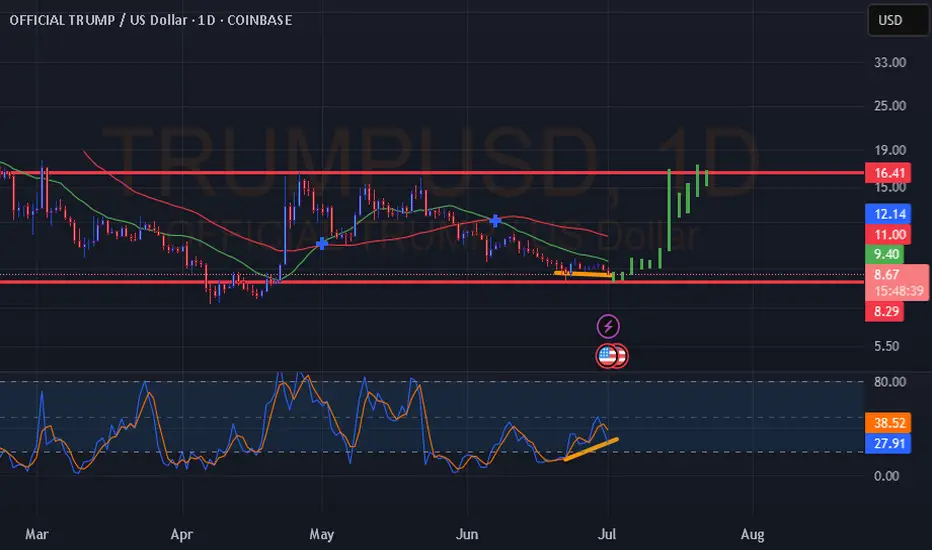
TRUMP USD Bullish DivergenceHi Everyone. TRUMP showing some strength here. Could be an overall price reversal starting off as indicated. Not financial advice. Good luck.
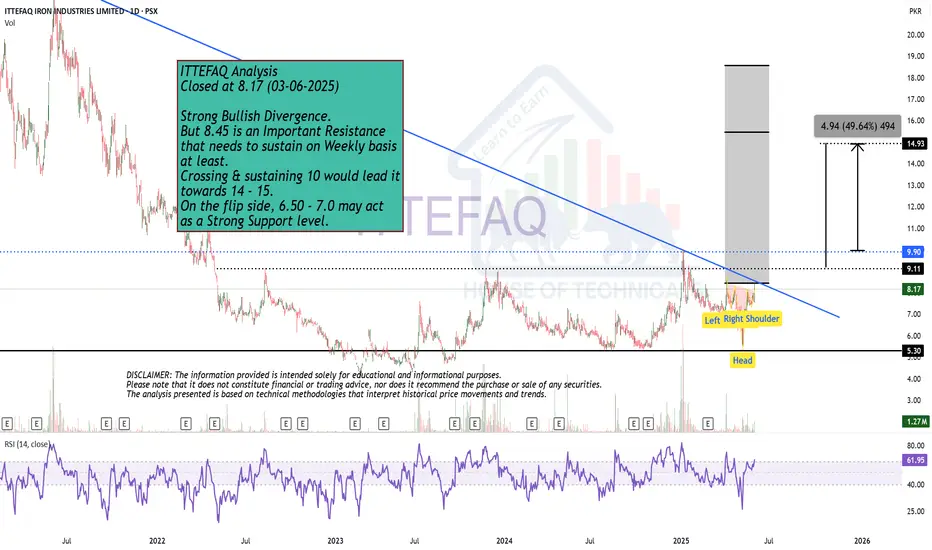
Strong Bullish Divergence. Closed at 8.17 (03-06-2025)
Strong Bullish Divergence.
But 8.45 is an Important Resistance
that needs to sustain on Weekly basis
at least.
Crossing & sustaining 10 would lead it
towards 14 - 15.
On the flip side, 6.50 - 7.0 may act
as a Strong Support level.
Hidden Bullish Divergence on Bigger tf.HTL Closed at 44.65 (13-05-2025)
Hidden Bullish Divergence on Bigger tf.
If 41 is not Broken, we may witness
upside towards 46.50 - 47 & then
50 to 55.

Bullish divergence on MKC Daily
Bullish div on ME, mLines, ATR channels and slightly on sRSI
Impuls on factor 5 TF is red, but EFI is turning from an extreme level and factor 3 is blue impulse
E: 72,73
TP: 75,43
SL: 70,86
RR: 1:1.44
Trade #00012
Note:
I posted this when price was 72.45, at market open, but I could not post my regular charts as of now on Tradingview does not allow it when you publish indicators that are private.
So this chart already shows part of the move.
This is trade number 12.
Score so far is: 7 out 11 63,6% hitrate

LTCUSD💡 LTC/USDT – 4H Chart Setup
Bullish Divergence spotted on the 4H timeframe.
📌 Trade Plan
Entry (Buy Stop): 91.08 (Break of Lower High)
Stop Loss (SL): 81.95
Take Profit 1 (TP1): 98.89
Take Profit 2 (TP2): 106.86
📈 Risk Management
Open 2 positions
Once TP1 is hit, trail SL to Entry (EP) to secure risk-free run toward TP2
🧠 Reasoning:
Bullish divergence indicates potential reversal. Entry planned above the LH to confirm momentum shift.

Bullish Divergence
Closed at 26.89 (05-06-2025)
27.50 - 28 is an Immediate Important
Resistance that needs to cross & sustain
for further upside.
There is a Bullish Divergence which may
help this time to break the resistance.
But better approach would be to wait
for the Resistance to cross & then take entry.
If it does, 32 - 33 is easily reachable.
On the flip side, it should not break 23.50
otherwise there would be more selling pressure.

Bullish Flag Pattern on Bigger tf + Bullish Divergence
Closed at 60.50 (02-06-2025)
Bullish Flag Pattern on Bigger tf + Bullish Divergence
is there.
54.50 - 62.50 is an Important Support
Zone. If this level is Sustained, we may
witness further upside towards 70-71.
A very Important Resistance Level is around 90-92
which if Crossed with Good Volumes, may expose
new highs.
On the flip side, breaking 51 may bring more selling
pressure.

Hidden Bullish Divergence on Bigger tf.IMAGE
Closed at 21.94 (27-05-2025)
Hidden Bullish Divergence on Bigger tf.
Monthly Closing above 20.70 will be a
positive sign.
Upside Targets can be around 26 - 26.50
On the flip side, 20.50 - 20.68 is a Good
Support zone and then around 19.
Should not break 17.30, otherwise we may
witness nd Reversal.

Failed Wedge, New Setup. Is SUI About to Break Out?In my previous post about BYBIT:SUIUSDT , I mentioned a potential falling wedge pattern. However, the breakout above the 4.0040 resistance turned out to be a false breakout, and the price eventually dropped to the invalidation level at 3.5868. This made the setup invalid.
But despite the failed wedge breakout, BYBIT:SUIUSDT remains in a bullish trend overall. During the current consolidation, the price appears to be forming a new bullish pattern — a Descending Broadening Wedge (DBW).
This pattern typically starts with low volatility and gradually widens. Once price reaches its lower boundary, it often experiences a strong breakout to the upside.
Let’s break down the key price action in this DBW setup:
Price is moving within a Descending Broadening Wedge and is currently near the lower boundary of the pattern.
It’s also sitting around a key support level at 3.4833.
A rejection candle formed right at 3.4833, showing the market’s response to this support area.
A reversal confirmation would come if the price breaks above 3.6102.
A bullish divergence is also visible — price is forming lower lows, while the stochastic indicator is forming higher lows.
Based on these five price action signals, it seems that buyers are still in control, even though short-term volatility has created a series of lower lows.
That’s why I still believe BINANCE:SUIUSDT has more room to go up. What’s your take on this?

Double Bottom + Bullish Divergence.2280 - Closed at 51.80 (26-05-2025)
Double Bottom + Bullish Divergence.
Channel Bottom & respecting Trendline so far.
Crossing 53.20 with Good Volumes may
result in reaching 55 - 56.
50.30 should be the SL.

Bullish Divergence on Bigger tf.4337 - Closed at 4.35 (26.05-2025)
Bullish Divergence on Bigger tf.
4.15 - 4.30 seems to be a Strong Support.
But needs to cross & sustain 4.45 at
least for further upside.
It has the potential to touch 5.35 - 5.50
& then 6 -7

Coiling for a Breakout – Watch This LevelAfter a strong upward move, BYBIT:SUIUSDT is currently consolidating in a sideways range, forming what appears to be a falling wedge pattern — a classic bullish continuation setup.
If this pattern plays out, there's a good chance the price will resume its uptrend, supported by a bullish divergence forming within the wedge. The key level to watch is the resistance at 4.0040. A clean breakout above this level should be backed by strong momentum. However, if the price breaks above but quickly drops back below 4.0040, it could signal a lack of buying pressure — increasing the risk of a failed breakout.
This bullish scenario remains valid as long as the price holds above 3.5868. The next potential upside targets are 4.7996 and 5.0552.
Keep an eye out for a high-volume breakout and a strong candle close above 4.0040 to confirm the move.
What’s your take on BINANCE:SUIUSDT ?

Conslidation Box
Closed at 9.14 (23-05-2025)
Trying to break the long consolidation box.
Important Support Zone is around 8 - 8.70
Channel bottom is around 5.30 which seems
unlikely as of now because of Bullish Divergence
on weekly tf.
Upside targets can be around 11 & then around 14

Beautiful SetupClosed at 141.02 (21-02-2025)
Beautiful Bullish Divergence +
Inverse H&S in progress.
As mentioned earlier, 144 - 146 is
an immediate resistance; once crossed
& sustained, we may witness 152 - 155
& then 175 - 180.

Bullish Divergence
Bullish Divergence is appearing on bigger tf.
Crossing & Sustaining 9 may lead it towards
14 - 15.

Bullish Divergence on DTF.
Bullish Divergence on DTF.
Important Resistance is around 52.50
However, sustaining this level will
expose 55 - 60 zone.

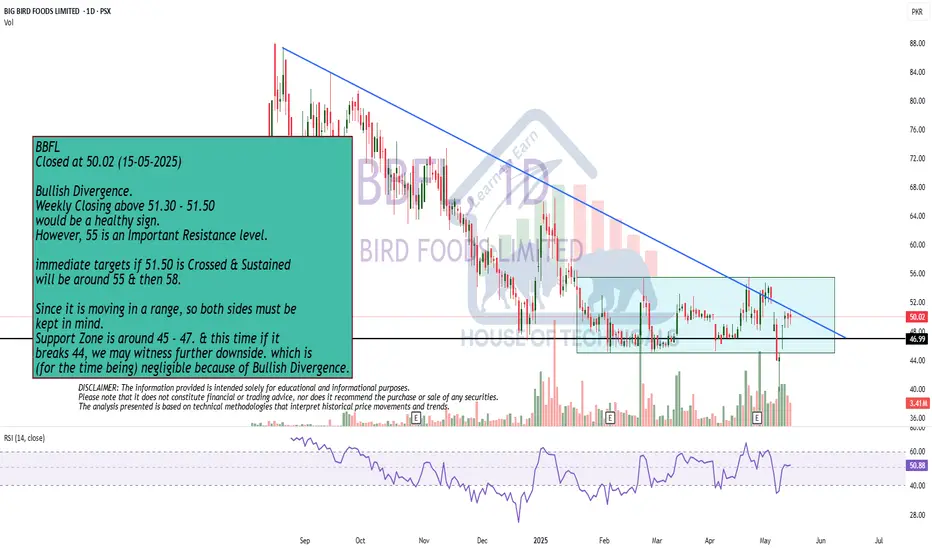
Bullish Divergence.
Bullish Divergence.
Weekly Closing above 51.30 - 51.50
would be a healthy sign.
However, 55 is an Important Resistance level.
immediate targets if 51.50 is Crossed & Sustained
will be around 55 & then 58.
Since it is moving in a range, so both sides must be
kept in mind.
Support Zone is around 45 - 47. & this time if it
breaks 44, we may witness further downside. which is
(for the time being) negligible because of Bullish Divergence.