Bullish divergence is there but
Bullish divergence is there but
19-19.10 is Important to Sustain on
Monthly basis.
also there is a Very Important
Support around 16.30 - 17.20
Bullish Divergence

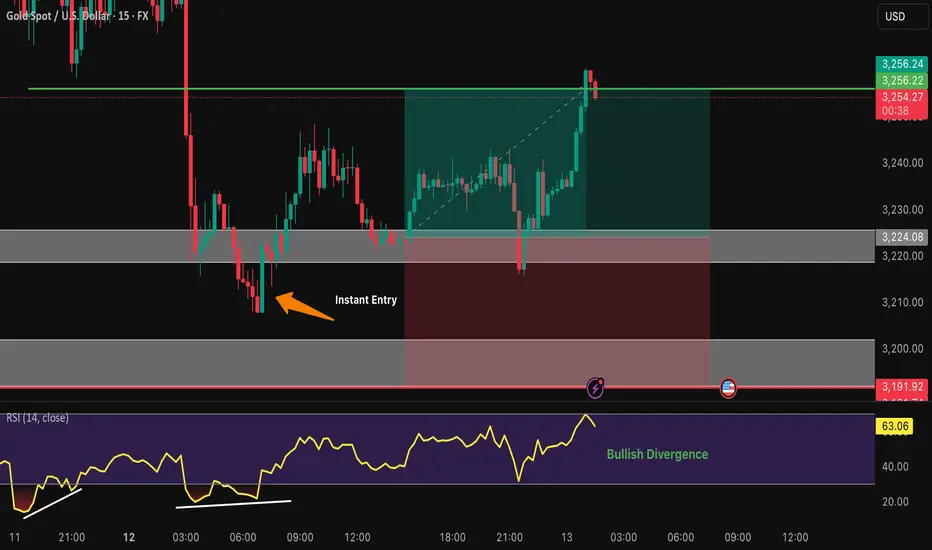
GOLD 15M1: Bullish Divergence.
2: Strong Support on 1H Timeframe.
3: Risk Reward Ratio 1:1
4: Entry point based on Cambist 15M
5: We could see an short term uptrend.
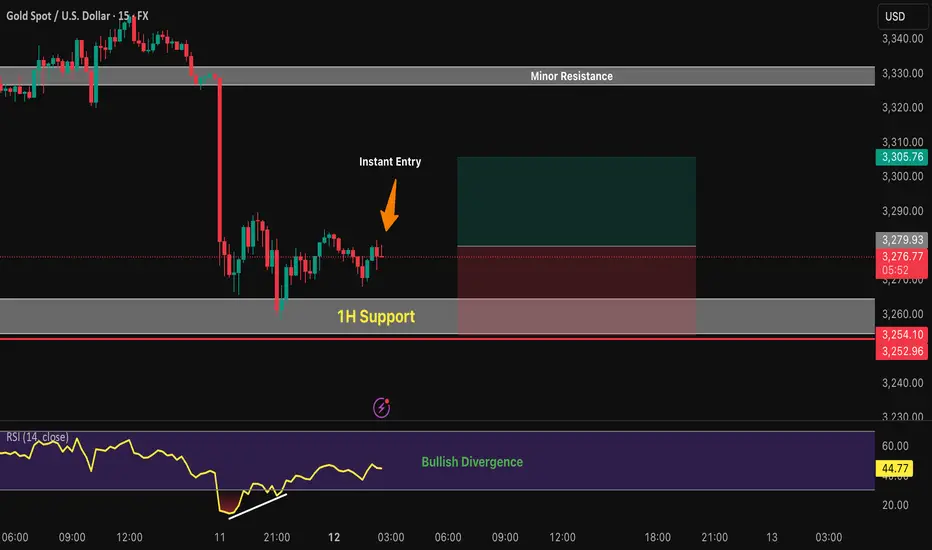
GOLD 15M1: Bullish Divergence.
2: Strong Support on 1H Timeframe.
3: Risk Reward Ratio 1:1
4: Entry point based on Cambist 15M
5: We could see an short term uptrend.
Hidden Bullish Divergence
Hidden Bullish Divergence is there.
Still have the potential; and may touch
17 & then around 21.
Trailing SL (at 13) is the Best Strategy for those who
are in this Trade as per our last analysis shared.

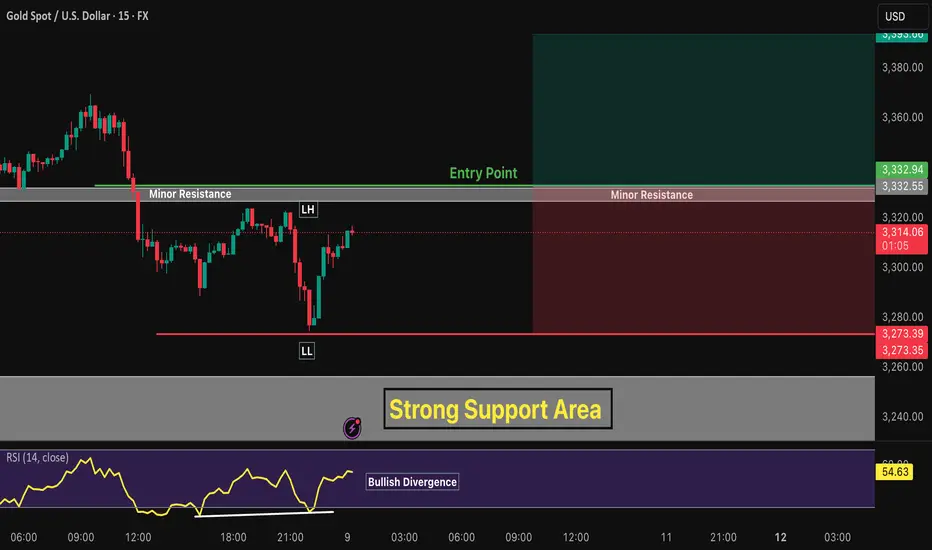
GOLD 15M1: Bullish Divergence.
2: Strong Support on 2H Timeframe.
3: Risk Reward Ratio 1:1
4: Entry point based on the break of last LH (Lower High) and a minor resistance.
5: We could see an short term uptrend.
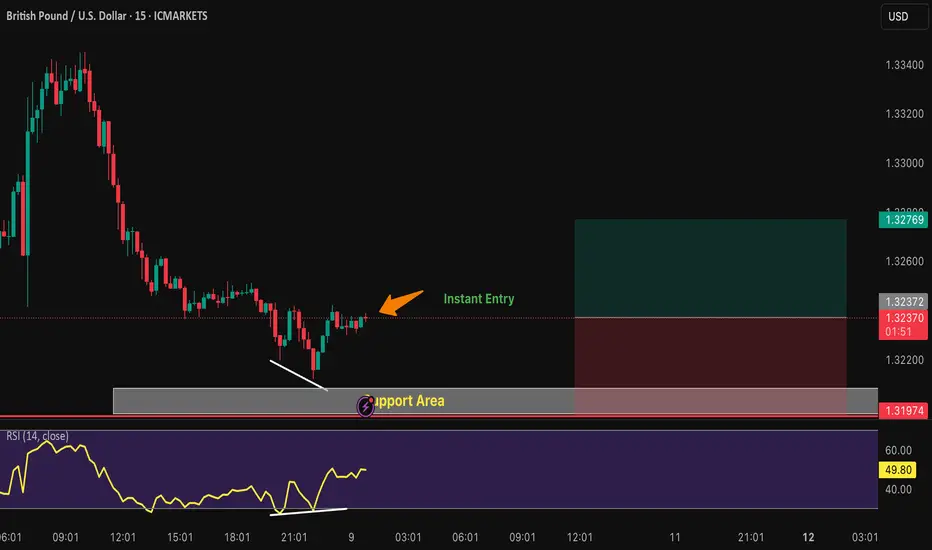
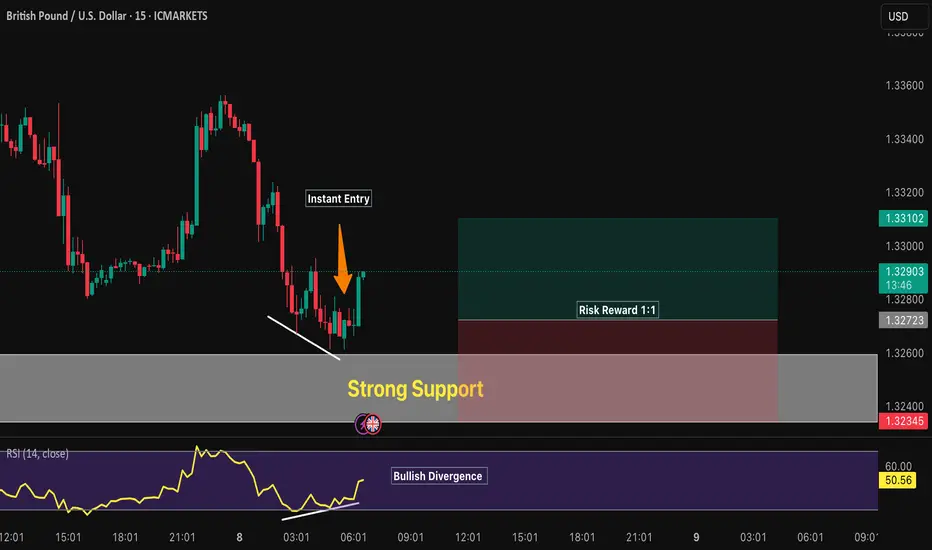
GBPUSD 15M1: Bullish Divergence.
2: Support on 1H Timeframe.
3: Risk Reward Ratio 1:1
4: Instant entry based on Cambist strategy.
5: We could see an short term uptrend.
GBPUSD 15M1: Bullish Divergence.
2: Strong Support on 2H Timeframe.
3: Risk Reward Ratio 1:1
4: We could see a strong uptrend on price action.
Hidden Bullish Divergence +Hidden Bullish Divergence +
Closing above 298 is a +ve sign.
Immediate Support can be around 283 - 287.
Breaking 272 may bring more
selling pressure towards 246 - 250.

Still a Good Buy but with proper Stoploss.Still a Good Buy but with proper
Stoploss.
Immediate Resistance is around 134 - 135
Crossing it may take the price towards
140 - 144 initially. & then the Double Bottom
will play and may hit 160+


Bullish Divergence!
Good to Buy on dips with SL 97
TP1 around 100 - 101
TP2 around 102 - 102.50
Crossing & Sustaining 106 may
lead it towards 113 - 115.

Strong Bullish DivergenceStrong Bullish Divergence has appeared.
If today's low is not broken,we may witness 173 - 175 initially
& then around 180 - 185.

Bullish Divergence has appeared.
Bullish Divergence has appeared.
Plus a Very Important Support level around 165-167
a bounce is expected from this level. However,
unless 193-196 is Crossed & Sustained ,we may not see
the trend reversal.

Bullish Divergence on bigger time frames.
Bullish Divergence on bigger time frames.
Currently in a Consolidation box.
Those who cant wait for long, should wait
for the breakout around 9.
Upside targets can be around 11 - 11.50
initially.
Strong Support seems to be around 6.
On the flip side, if this Support is broken,
the next levels would be around 3.

Currently at a Very Strong Support.Currently at a Very Strong Support.
Bullish Divergence has appeared.
Crossing 136 may lead it towards 140 & then 148 - 149
initially.
On the flip side, it should not break 114.50 now.
Otherwise, we may witness further Selling Pressure
towards 88 - 90.

No Bearish Divergence on Monthly Tf.No Bearish Divergence on Monthly Tf.
But 39-40 is a Very Strong Resistance
that needs to Cross & Sustain with Good Volumes to
reach 45 - 46 & then 50+
We should not ignore that it has taken Support
from a Very Important Fib level around 32.40
Monthly Closing above 33.60 would be a Very Healthy sign.
So any dip towards 32.50 - 33.50 can be a Buying Opportunity.
However, it should not break 31.80 otherwise we
may witness further Selling Pressure towards 28.50 - 28.70

DXY bullish divergenceDXY is showing a bullish divergence on the 1H timeframe, price made lower lows while RSI made higher lows. This suggests potential upside momentum building up, so a short-term bounce or reversal could be in play. Keep an eye on resistance levels for confirmation.

Massive bullish divergence on BTCUSD 1D chartThe is a massive bullish divergence on the BTCUSD 1D chart.


Bullish Divergence on Monthly TF.Bullish Divergence on Monthly TF.
Weekly Support seems to be around 30.
& Important Resistance is around 32-33.
Though a re-testing of breakout done. but
Important to Sustain 24.90
As of now, Stock is in sideways movement;
& it will be Bullish once it will cross 36.
A positive point is that there are multiple
bullish / hidden bullish divergences on
different time frames.

Bullish Divergence on Weekly TF.Bullish Divergence on Weekly TF.
Seems like taking Support from a Very Important
fib. level around 10.30 - 11.40
Falling Wedge Pattern on Daily TF.
10.90 Should be Sustained on Monthly Basis, otherwise
we may witness further Selling pressure till 8.
Important Resistance is around 12.30 - 12.65 as of now.

Did $TGT trigger a Bullish Divergence or is it just a Bull Trap?NYSE:TGT appears to have found support in the $100 - $105 range. I’ve been monitoring the stock and noticed a significant surge in institutional buying volume during the latter half of Friday’s session (3/21/2025), with nearly 32 million shares traded. The last time we saw such an unusual spike in volume, it triggered a gap-up and a sustained rally from 11/2023 to 4/2024.
A particularly notable development is the sharp increase in call option activity when the price dipped to the $101.xx zone early in the session. Both premiums and implied volatility (IV) spiked higher than usual. Additionally, MACD is on track for a bullish crossover by the final week of March 2025, while RSI, currently in the oversold zone, is showing signs of a recovery with a bullish divergence forming.
If Monday (3/24) and Tuesday (3/25) close green, expect selling pressure on Wednesday and Thursday. Friday (3/28/2025) will be a decisive session to determine whether Target can rebound toward $110 - $120 - $130.
However, Bearish on Weekly is the main trend, also keep in mind that Trump’s tariffs are still looming, with the next deadline set for Canada & Mexico is 4/2/2025. Don’t expect another extension. If you’re in profit, consider closing positions in this week. If Target fails to hold the $100 - $105 support zone, the next destination could be $90.
Disclaimer.

$BTC Battle at 200DMA - Bullish DivergenceThe 200DMA is the real battle for bulls and bears rn.
At least PA is respecting my squiggles 😊
Bullish Divergence is the key here.
