Bullish Divergence appearing!2222 - Closed at 24 (03-08-2025)
Currently in Downtrend.
However, Bullish Divergence has
started appearing on Bigger tf.
Bearish ABCD pattern target seems to
be around 22 - 23 & it may reverse from
that point. But Confirmation will be
required before taking position. Otherwise,
Next possible Support level can be around 20 - 20.50.
Immediate Resistance seems to be around 25 - 26.
It needs to cross & sustain 29 to start its Uptrend.
Bullishdivergencersi

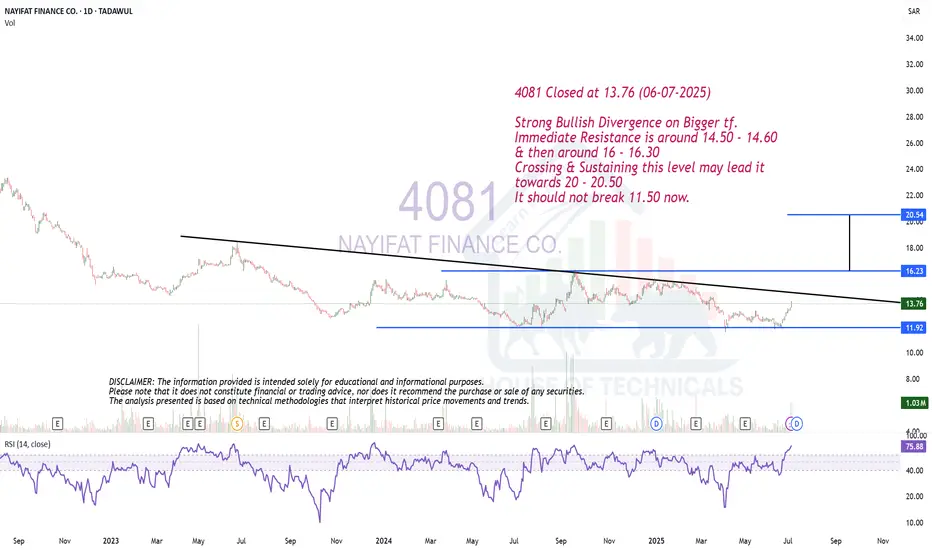
Strong Bullish Divergence on Bigger tf.4081 Closed at 13.76 (06-07-2025)
Strong Bullish Divergence on Bigger tf.
Immediate Resistance is around 14.50 - 14.60
& then around 16 - 16.30
Crossing & Sustaining this level may lead it
towards 20 - 20.50
It should not break 11.50 now.
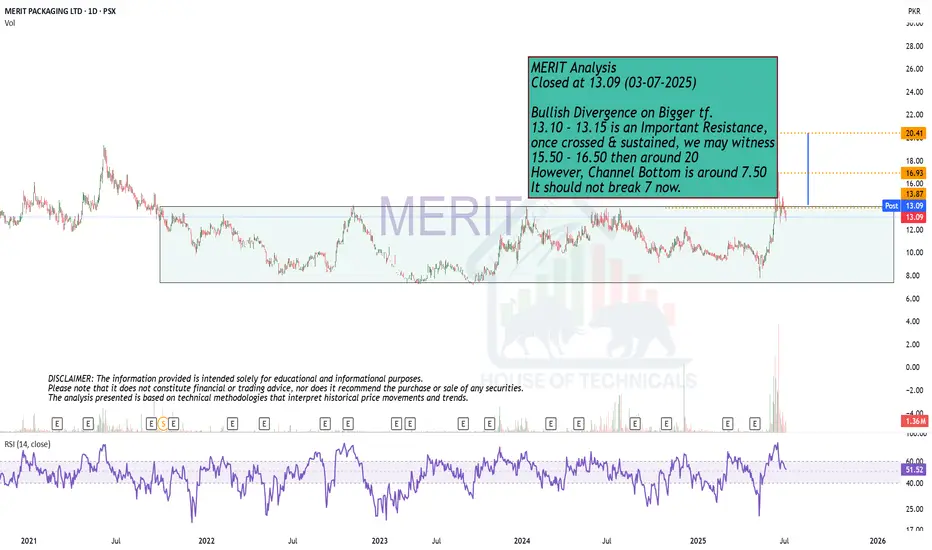
Bullish Divergence on Bigger tf.MERIT Analysis
Closed at 13.09 (03-07-2025)
Bullish Divergence on Bigger tf.
13.10 - 13.15 is an Important Resistance,
once crossed & sustained, we may witness
15.50 - 16.50 then around 20
However, Channel Bottom is around 7.50
It should not break 7 now.
Very Good Monthly Closing.
Closed at 323.58 (30-05-2025)
Very Good Monthly Closing.
Seems like Crossing the Resistance of 329-330
this time.
Potential to touch 390 -400 initially & then
500+ if 395 is Sustained.
However, should not break 305 - 307.

Bullish Divergence on Bigger tf.4337 - Closed at 4.35 (26.05-2025)
Bullish Divergence on Bigger tf.
4.15 - 4.30 seems to be a Strong Support.
But needs to cross & sustain 4.45 at
least for further upside.
It has the potential to touch 5.35 - 5.50
& then 6 -7

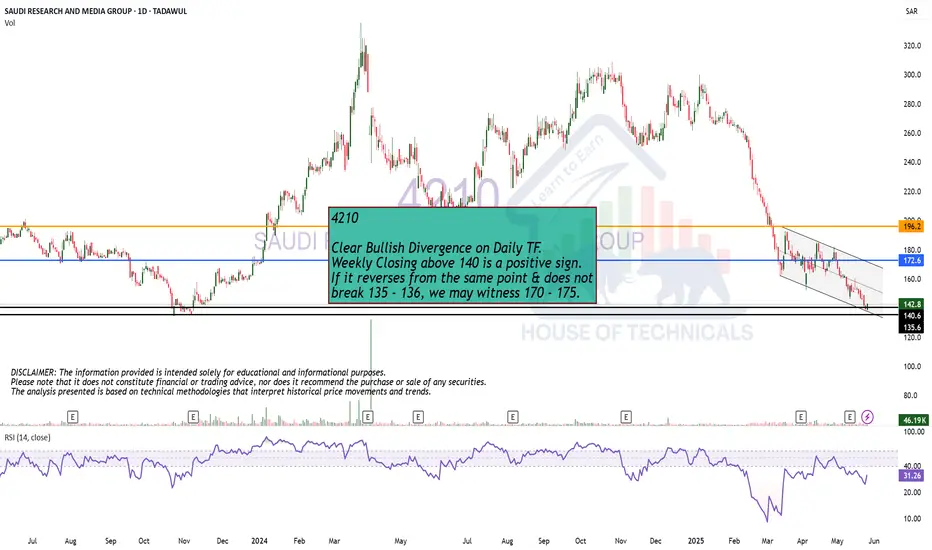
Clear Bullish Divergence on Daily TF.
Clear Bullish Divergence on Daily TF.
Weekly Closing above 140 is a positive sign.
If it reverses from the same point & does not
break 135 - 136, we may witness 170 - 175.
Bullish Divergence
Bullish Divergence is appearing on bigger tf.
Crossing & Sustaining 9 may lead it towards
14 - 15.

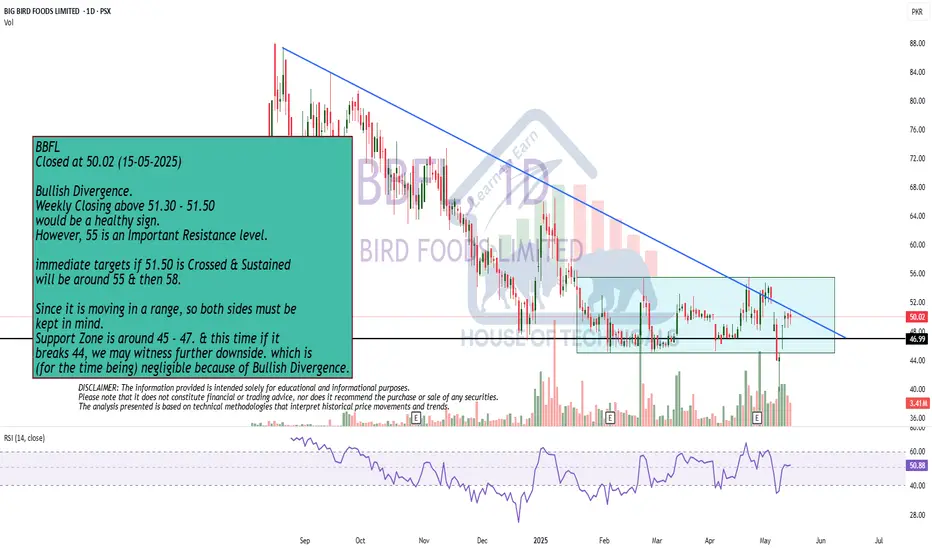
Bullish Divergence.
Bullish Divergence.
Weekly Closing above 51.30 - 51.50
would be a healthy sign.
However, 55 is an Important Resistance level.
immediate targets if 51.50 is Crossed & Sustained
will be around 55 & then 58.
Since it is moving in a range, so both sides must be
kept in mind.
Support Zone is around 45 - 47. & this time if it
breaks 44, we may witness further downside. which is
(for the time being) negligible because of Bullish Divergence.
$SOL / $BTC Inverse Head and Shoulders BREAKOUT!!CRYPTOCAP:SOL / CRYPTOCAP:BTC Inverse Head and Shoulders reversal pattern confirmed 🥳
PA has also reclaimed the 50DMA
Bullish Divergence on RSI
So many signs indicators aligning across the market.
IS IT REALLY TIME !!?!?

LQTYUSDT Bouncing Back!LQTYUSDT Technical analysis update
LQTYUSDT has bounced off a strong support zone, the same level where it previously showed a strong rebound. A bullish RSI divergence is visible on the daily chart, suggesting a potential bullish move from the current levels.
Buy zone : Below $0.76
Stop loss : $0.625

$HNT Bullish Exaggerated Divergence on Daily RSIBeen accumulating a very large position of FWB:HNT
Bullish Exaggerated Divergence on the Daily RSI.
Price looks to have bottomed claiming previous lows.
Helium Mobile is one of the strongest IRL DePin projects 💯
$600m Market Cap is extremely undervalued compared to the rest of the industry.

$BTC Trading Idea – Short-Term BounceCRYPTOCAP:BTC Trading Idea – Short-Term Bounce
Pattern: #BTC is forming a double bottom, indicating a potential trend reversal.
RSI Divergence: Clear bullish divergence on RSI confirms buying momentum.
Target Levels:
First target: $89,000
Second target: $91,000
Third target: $93,500
Outlook: Expecting a short-term bounce before a potential correction. Monitoring price action closely for confirmation.
This setup suggests a high-probability move to the upside in the near term.

a Sign of Hope..Continuously making LH LL (Downtrend).
Currently at an Important Support level.
Double Bottom formation around 1200.
Bullish Divergence is there on Daily TF, which is a Positive Trigger.
However, the stock will reverse its trend once it will Cross & Sustain 1465 atleast.
& if this level is Crossed & Sustained, we may witness 1700 - 1730 initially.
On the flip side, breaking the Current Level (around 1200), will bring more selling pressure
& we may witness 1000 - 1040.

TSLA - Solid Bullish Divergence TSLA has been a solid short but I have a hard time believing that this stock is down for the count. Apparently I am not the only person who is thinking this way because in spite of the downside price action, the RSI (Relative Strength Index) is indicating that sentiment is overall bullish still and price should reflect it in the short term. I don’t know if I feel super bullish with the macro outlook but as far as expecting a decent bounce out of TSLA in the short term- probability points to more likely than not- upside price action in the short term.

Descending Wedge & Bullish Divergence on March SoybeansFundamental Outlook:
There’s no beating around the bush - the fundamental outlook for soybeans is bearish. Global ending stocks are now at all time highs per the last WASDE report, and export demand for U.S. soybeans has slowed considerably - currently down around 19% year-over-year. As South American harvest progresses, the outlook of the Brazilian soybean crop has also improved.
Talking Technicals:
Despite the bearish fundamental outlook - the descending wedge, bullish divergence on 14-day RSI, and declining volume profile presents a bullish setup. Managed money funds remain aggressively short - holding a net-short position greater than 150,000 contracts across futures and options on soybeans. An upside breakout could result in short-covering, ultimately propelling prices higher in the near-term. Descending wedge patterns typically see sharp, upside breakouts which would be akin to the price action observed in a short-covering rally.
Check out CME Group real-time data plans available on TradingView here: www.tradingview.com
Disclaimers:
CME Real-time Market Data help identify trading set-ups and express my market views. If you have futures in your trading portfolio, you can check out on CME Group data plans available that suit your trading needs www.tradingview.com
*Trade ideas cited above are for illustration only, as an integral part of a case study to demonstrate the fundamental concepts in risk management under the market scenarios being discussed. They shall not be construed as investment recommendations or advice. Nor are they used to promote any specific products, or services.
Futures trading involves substantial risk of loss and may not be suitable for all investors. Trading advice is based on information taken from trade and statistical services and other sources Blue Line Futures, LLC believes are reliable. We do not guarantee that such information is accurate or complete and it should not be relied upon as such. Trading advice reflects our good faith judgment at a specific time and is subject to change without notice. There is no guarantee that the advice we give will result in profitable trades. All trading decisions will be made by the account holder. Past performance is not necessarily indicative of future results.

Is A Short-Covering Rally in Corn Imminent? There’s no beating around the bush - the fundamentals for corn remain bearish ahead of Thursday’s USDA report. Last month, USDA caught many by surprise revising ‘23 corn yields to record-highs of 177.3 bushels per acre. Since then, corn futures have continuously grinded lower. But, could a short-covering rally be in the offing soon?
Per the last CFTC Commitments of Traders report, managed money funds have amassed a net-short position of 280,151 contracts (combined futures & options). That represents the largest net-short position in corn since 2019. While corn has continued making new lows, each of the last 4 contract lows have come in conjunction with less and less conviction - namely bullish divergence on the standard 14-day RSI. Moreover, the volume profile has gradually softened since the January USDA report. Thus, it's possible that all of the bears have already sold. The first step in a short-covering rally is getting bears to stop selling - and a friendly WASDE report on Thursday bares the potential to make that happen.
Check out CME Group real-time data plans available on TradingView here: www.tradingview.com
Disclaimers:
CME Real-time Market Data help identify trading set-ups and express my market views. If you have futures in your trading portfolio, you can check out on CME Group data plans available that suit your trading needs www.tradingview.com
*Trade ideas cited above are for illustration only, as an integral part of a case study to demonstrate the fundamental concepts in risk management under the market scenarios being discussed. They shall not be construed as investment recommendations or advice. Nor are they used to promote any specific products, or services.
Futures trading involves substantial risk of loss and may not be suitable for all investors. Trading advice is based on information taken from trade and statistical services and other sources Blue Line Futures, LLC believes are reliable. We do not guarantee that such information is accurate or complete and it should not be relied upon as such. Trading advice reflects our good faith judgment at a specific time and is subject to change without notice. There is no guarantee that the advice we give will result in profitable trades. All trading decisions will be made by the account holder. Past performance is not necessarily indicative of future results.

GBPUSD ALERT: BULLISH DIVERGENCE DETECTED! 🚨📈💡 GBPUSD ALERT: BULLISH DIVERGENCE DETECTED! 📈🚀
🔍 What we've discovered during our examination: 🔍
📈 Bullish Divergence: Despite the prevailing bearish trend, we've identified a bullish divergence forming on the GBPUSD 1-hour chart. This could be a sign of a potential trend reversal! 📉🔄📈
📈 Relative Strength Index (RSI): The moment indicator RSI is backing this bullish divergence signal, suggesting a possible upward momentum in the near future! 📊🚀
🚨 Trading Alert: 🚨
📌 Time Frame: 1 Hour ⏰
📌 Pair: GBPUSD 🇬🇧💱🇺🇸
📣 Our analysis indicates a potential bullish move for GBPUSD, but a word of caution before you hit that trade button: 🛑⚠️
🚫 Trading always involves risk, and even though the indicators look promising, it's essential to consider your risk tolerance and use proper risk management strategies. 💼🛡️
💡 Trading Tip: 💡
📌 Wait for Confirmation: It's crucial to wait for additional confirming signals before entering any trade. Always look for supporting evidence to strengthen your trade decision. 🕵️♂️🔍
📌 Set Stop-Loss: Protect your capital! Always set a stop-loss order to limit potential losses in case the trade doesn't go as planned. 🛡️💰
📌 Stay Informed: Keep an eye on market news and events, as they can impact the forex market. Stay updated to make informed decisions! 📰🌍
Remember, the market can be unpredictable, so never risk more than you can afford to lose! 🙅♂️💸 Trade responsibly and smartly! 🧠💪
Happy trading! 🚀📊💹
#Forex #GBPUSD #BullishDivergence #TradingAlert #TradeResponsibly

AUDCAD - Bullish Divergence in 1H ALERTAUDCAD - Bullish Divergence in 1H ALERT
Over All trend is bearish in 1 H as per trend line as making LHs & LLs, but momentum indicator RSI is making HHs and HLs , which clearly shows bullish divergence in trend.

Bico is bullish , bullish divergence rsiBico is accommulating from a long time now it shows bullish divergence in weekly tf ,
My Targets will be 40% - 70%
DYOR , NFA,

PYPL | Perfect Entry Point | BouncePayPal Holdings, Inc. operates a technology platform that enables digital payments on behalf of merchants and consumers worldwide. It provides payment solutions under the PayPal, PayPal Credit, Braintree, Venmo, Xoom, Zettle, Hyperwallet, Honey, and Paidy names. The company's payments platform allows consumers to send and receive payments in approximately 200 markets and in approximately 100 currencies, withdraw funds to their bank accounts in 56 currencies, and hold balances in their PayPal accounts in 25 currencies. PayPal Holdings, Inc. was founded in 1998 and is headquartered in San Jose, California.

GOING Long in CADJPY Trading StrategyBullish Indications
1. Tweezer Bottom and 3 White Soldiers
2. Tested Strong Support
3. Bullish AB=CD Pattern
4. Bearish Trend is Mature Enough
5. Need to Break Resistance Upper Trend Line
6. Found a very strong bullish divergence on 1D
7. Falling Wedge
8. 11 out of 16 times remain bullish
Bearish Indications
1. Lower highs and Lows
2. If it breaks support then we can enter
Seasonal Data 2006-2021
Dec-06 => Green
Dec-07 => Green
Dec-08 => Red
Dec-09 => Green
Dec-10 => Green
Dec-11 => Red
Dec-12 => Green
Dec-13 => Green
Dec-14 =>Red
Dec-15 => Red
Dec-16 => Green
Dec-17 => Green
Dec-18 => Red
Dec-19 => Green
Dec-20 => Green
Dec-21 => Green

BTC UPDATE! $18K INCOMING!!Hello everyone, if you like the idea, do not forget to support it with a like and follow.
Welcome to this quick BTC update. BTC rejected from the $16.8k level and made another LL around the $16k level.
Why does BTC go to $18k from here?
* BTC already breaks out from the falling wedge-like structure and currently consolidating above the triangle.
* Producing a bullish divergence in RSI in a 4hr time frame.
* $15.8k$16k is a very important area to hold.
* Currently, BTC is consolidating above the $16k level and throwing out from the market who have less patience and use high leverage. Once it is done a bullish rally up to $18k is highly possible.
Invalidation:- 4hr close below $15.8k level
If you like this idea then do support it with like and follow.
Also, share your views in the comment section.
Thank You!

GOOGL with Bullish Divergence on Daily Chart!Bullish divergence on the daily chart!
A bullish divergence is a high probability setup. The RSI & OBV indicators made higher lows.
In my opinion, Google will make a decent move over the next few days or within a few weeks.
It is my prediction that, Google will make a decent move over the next few days, or within a few weeks.
Peace, Love & Abundance,
MrALtrades00
