Is it the Bullish Flag?Daily Chart
I spot the Bullish Flag or Falling Wedge on ARB's chart
Now, it's trading at 0.859x and moving up to resistance around $1
If it can break and close above this resistance that is huge profit for next bull cycle.
Wait for next move
Bullish Flag

GBPJPYGBPJPY is in strong bullish trend.
As the market is consistently printing new HHs and HLs.
currently the market is being respected by inclining trendline and has also formed bullish flag pattern which is also being supported by inclining trendline.
These two to gather putting strong bullish confluence for the pair.
What you guys think of this idea

Bull Flag or Gap Fill......!?!?!?Garmin popped after beating earnings both Top & Bottom, and has now a "Bull Flag Pennant". We also have a $4 gap created overnight after earnings! How should we play this setup❓❗️❓❗️

🔥 PEPE Bull-Flag Break Out Soon: Next Leg Up!PEPE has been consolidating for nearly a week at this point, after a huge >120% move upwards.
In my eyes, PEPE is underway of making a bull-flag pattern. Since bull-flags classically break bullish, this is what we're waiting for.
I'm waiting for a 4H close above the previous local top of 124, with a 200 target. If BTC manages to break out on bullish FED news tonight, PEPE can fly as well.
Exciting times for altcoins.

ETH's Nested Flags: Bull Flag within a Bear FlagPrimary Chart: Weekly Candle Chart of ETH/USD with Competing Flag Scenarios
Longer-Term Analysis
BITSTAMP:ETHUSD has been largely in a trading range since making its low in June 2022. Yes, some of the moves within that range have been quite substantial. The move off the June 2022 low to the early August 2022 high was about +130.59% higher. The next leg higher from the early November 2022 low to the April 2023 high was about a +99% move. In between those moves was a substantial -47.29% downdraft. (Downdrafts may have quite a smaller percentage because the starting point begins much higher than the starting point for an up move.)
But big volatility, huge moves, don't guarantee a strong trend either way. A stock can chop up and down in a volatile way while its overall progress remains relatively insignificant given the volatility and moves. Consider the 1-year uptrend on the Primary Chart. The trend does not form a powerful, steep upward slope, moving sharply higher for many weeks consecutively like other charts we have come to see in recent months, e.g., NVDA, AAPL.
Instead, the trend has largely been sideways with a modest uptrend with only a gradual incline despite the big moves within this well-defined channel. This could be a bear flag, though that is not yet confirmed. It's a scenario in any case that should be kept in mind on a break of the upward trendline from June 2022 lows.
1. Bear-Flag Scenario: Chart A (also shown on the primary chart)
Notice how the VWAPs confirm the largely sideways ranging action. The VWAP from the all-time high and the VWAP from 2022 lows have been containing the price action YTD in 2023. Despite the gentle uptrend slope, the anchored VWAP from the all-time high reminds us of a more dynamic and flexible measure of trend, which is down from the all-time high in 2021.
2. Anchored VWAP from All-Time High: Chart B
The anchored VWAP from the all-time high remains formidable to price. Notice is power in resisting price up until now. However, the last rejection did not send price to new lows. This confirms the choppy sideways thesis for now. While the dark-blue VWAP from the ATH did reject price in April 2023, price has remained well above the anchored VWAP from the major June 2022 low. Currently, the ATH-anchored VWAP lies at $2,038. A close above this level suggests at least further upside in the near term. Traders of all time frames should keep this area in mind—it's sort of like a super-highway. You don't want to run out in the middle of it without looking carefully both ways.
The measured-move area is also shown here. Note that this is a logarithmic chart, so the measured move is somewhat higher than on a linear chart. This post will attempt to display measured moves on both.
3. Three Anchored VWAPS from Key Pivots: Chart C
The anchored VWAPs on this chart confirm the consolidation thesis discussed above. The VWAPs are anchored to key swing lows and highs since the all-time high. NOtice how the VWAPs from these various pivots have been compressing and flattening for months. This signifies another major trend move is likely to occur when this long-term consolidation completes. Many hope it will be an upward move back to highs. SquishTrade is less confident of that conclusion given inverted yield curves (see prior posts on this); however, over the coming weeks, maybe months, choppy to somewhat higher prices can occur.
4. Triangle Patterns within Triangle Patterns: Chart D
Triangles are consolidation patterns. The fact that we see triangle patterns within triangle patterns supports the idea that this 1-year channel is potentially consolidative of the move that preceded it. No guarantees, but that seems to be a logical inference. Some might counter that this is a major "cup base" though others may struggle to see anything resembling something that might hold one's tea. We'll see. Note: This is a linear chart, with a measured move based on the linear scaling.
5. Triangle pattern on a Logarithmic Chart: Chart E
This chart shows a triangle on a logarithmic scale. So now, switching to log scale doesn't necessarily change the thesis just yet. The measured move for the log scale gives a 1-year measured move off of June 2022 lows around $2467. If we extend the measured move to a 1.272 projection of the first leg off the June lows, then it runs up around $3000.
Long-term view summarized: As long as the uptrend from June 2022 lows holds, as well as the VWAP from that same bar, price can continue to remain supported, i.e., not crashing, sideways, rallies and dips within the defined ranges. In SquishTrade's view, $2,400 - $3000 is likely the maximum level ETH may achieve between now and the likely recession foretold by the yield curves. But higher-for-longer monetary policy in major European and North American countries may keep the ceiling even lower than that. Caution is warranted unless / until certain persistent (and 40-year record) yield curve inversions have proven that they finally gave a false signal for the first time ever.
Shorter-Term Commentary
Directional traders may be disappointed in the coming 2-3 weeks. A flag within a flag suggests more choppy price action overall—at least until a breakout of either occurs. The smaller flag may breakout first to the upside and lead us to the upper edge of the channel. The larger flag may breakout to the downside, and lead us to new lows. But neither has happened just yet. So price action for now may respect the ranges that are in play—both horizontal ranges and diagonal ones (channels). But it appears that price could largely could remain rangebound from a broader perspective for the coming weeks.
Conclusion
Traders and investors love a major directional move. It sparks adrenaline (maybe) and a combination of dreams / hopes or fears / frustration. Some traders wait eagerly at various levels to fade the move (long or short) once it has started to progress in earnest. Others who may have timed a good entry may be busy counting their profits, while trying to calm down enough to figure out a proper exit, and writing on their foreheads a reminder to "move the stop to breakeven." And still others may be sitting back patiently on the sidelines for months or years and hoping for an ideal capitulatory low after the dust has started to settle between buyers and sellers who may finally seem to have exhausted themselves.
In short, the confusion and choppiness of sideways to slightly upward price action is merely the market doing price discovery between all sorts of players including long-term underwater buyers who bought above 3500 and keep hoping the price will rise just enough to make them whole (increased supply), long-term holders who are true believers in the holding (reduced supply unless emotions shake them out), short sellers (supply and potential demand when a squeeze starts), derivatives traders (supply and/or demand due to hedging flow), intraday traders, scalpers, and, let's face it, some gamblers too. In general, the market action is a device for transferring wealth from the impatient to the patient, according to one investing legend, Warren Buffett. But sometimes the patient can be the short-term trader and the impatient can be the long-term investor—because a long-term investor may lack the patience to enter or exit properly, and a short-term trader may have the patience and discipline to execute some excellent swing trades, provided risk is managed and entries and exits are well-planned, well-timed and well-executed.
Minor disclaimer: This post is in no way advocating any particular investing or trading strategy. Short-term trading and long-term investing can both be either devastating or profitable (or somewhere in between those extremes) to the person engaging in it.
And thanks for reading this and for your encouragement and support.
________________________________________
Author's Comment: Thank you for reviewing this post and considering its charts and analysis. The author welcomes comments, discussion and debate (respectfully presented) in the comment section. Shared charts are especially helpful to support any opposing or alternative view. This article is intended to present an unbiased, technical view of the security or tradable risk asset discussed.
Please note further that this technical-analysis viewpoint is short-term in nature. This is not a trade recommendation but a technical-analysis overview and commentary with levels to watch for the near term. This technical-analysis viewpoint could change at a moment's notice should price move beyond a level of invalidation. Further, proper risk-management techniques are vital to trading success. And countertrend or mean-reversion trading, e.g., trading a rally in a bear market, is lower probability and is tricky and challenging even for the most experienced traders.
DISCLAIMER: This post contains commentary published solely for educational and informational purposes. This post's content (and any content available through links in this post) and its views do not constitute financial advice or an investment or trading recommendation, and they do not account for readers' personal financial circumstances, or their investing or trading objectives, time frame, and risk tolerance. Readers should perform their own due diligence, and consult a qualified financial adviser or other investment / financial professional before entering any trade, investment or other transaction.

in INJ BULL FLAG making. 1H TFin 1 hour time frame as you can see clearly making BULL FLAG on 1 hour time frame.

USDCAD: Bull Flag Breakout Targeting 1.13 Fibonacci ExtensionUSDCAD has broken out of a Bull Flag and will soon test the resistance of $1.3856. I think this resistance will break and that we will go up to the 0.886 retrace at $1.43, from there, we could sit sideways for a while before ultimately going for the measured move of this Bull Flag all the way up to the 1.13 Fibonacci Extension at $1.501

BullishFlag In GoldAs u can see gold trying to breakout out #BullishFlag H1 and H4 confirm bullish flag

99 pips to ignition... Please fasten your seatbelts...Gold on a bullish trend for next hours...
--
Gerald Mann is a U.S. veteran, and a cooperator with the White House, and a humanitarian cooperator with the IFRC. He was praised by Barack Obama in 2014, but they refused to help him to become an American resident. He holds several certificates of participation, majoring political science and business communications, from the Harvard University and the University of British Columbia. In 2016 he was attacked by some officers who injected a chemical agent into his abdomen, through deep rectal injection. Those days Mahmoud Alavi was the Minister of Intelligence of the mid-left governing party of Iran. To hide this action, while some of the militaries were aware of the upcoming complaint, several traitor officers of the "Iranians opposition nations" began to attack on him instead of giving guidance or any help. Including a specific group of very top-ranked officers of the remote-sensing military departments... Lately his exit-ban issue is almost solved and the Iranian government agreed that he leaves the nation.

Link breaking up from bullflag & inv H&SNot even factoring in the much larger monthly pattern link is breaking up from here and only focusing on the inv h&s and bullflag. Will be interesting to see how price action plays off these measured move lines on the way to their targets. While it seems like we have definitely triggered the breakup from the bullflag I don’t think it has officially broken upward from the inv h&s neckline just yet, but likely will soon. *not financial advice*

Dotusdt is ready to fly?Dotusdt is forming a bull flag which is bullish pattern sooner it could give huge breakout .
For the breakout DOT has to break the 4.6$ mark . For now dot is looking bullish in coming days we can expect dot to reach the price level of 4.3$.
.
.
.
.DYOR!!!

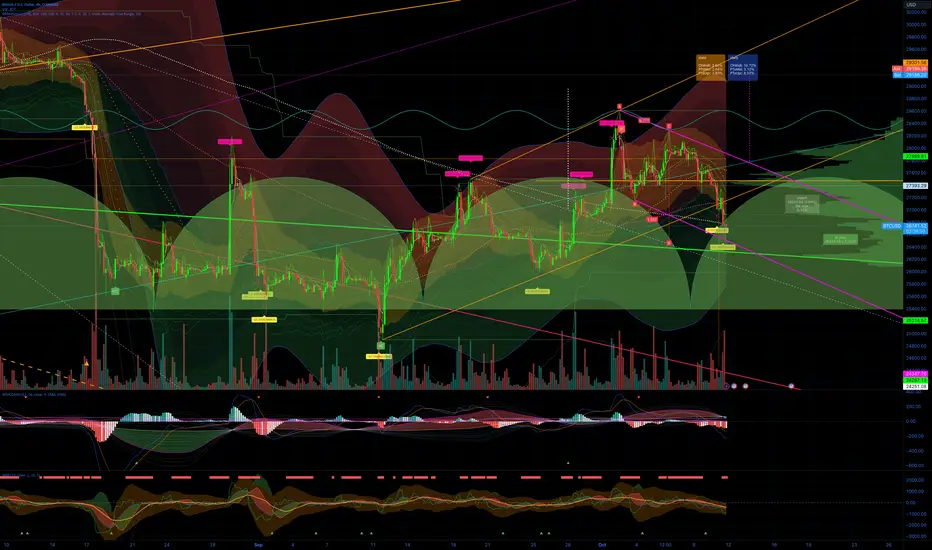
BTC Weekly Analysis: Breaking Trendlines & Anticipated Targets A comprehensive examination of Bitcoin's recent performance reveals a noteworthy development: its current valuation stands at $29,700, having breached a significant weekly trendline. This breach suggests a potential trajectory, with the immediate target identified at $31,818, followed by a subsequent level at $34,083. However, it's important to acknowledge the potential for a retracement to $29,038, though such a move is considered less probable at this juncture.
I'm looking for it to complete a Three-Drives-Pattern to the high.
#NFA

Target $32 for this timeChart 4H TF
Seem Bullish Flag has been creating on SOL's chart.
We need to wait a confirmation when Solana breakout and close above this flag.
Wait for next move

HOTUSDTHOTUSDT is in strong bullish trend.
As the market is consistently printing new HHs and HLs.
currently the market is being respected by inclining trendline and has also formed bullish flag pattern which is also being supported by inclining trendline.
These two to gather putting strong bullish confluence for the pair.
What you guys think of this idea?

Flag over flagThis drop was expected, and hopefully it ends there because it stems from what could be a bearish flag pointing lower. On the other hand, this movement created an ABC pattern, which ultimately forms a flag leading us to 29K
If we are not too bearish, we can go with the bull flag, and wait an explosive movement to the upside.
FLMUSDT No Stop Loss LONG 4 Hour Break.FLM lastly developed a Cup and also Deal with pattern in the 1hr duration. I am preparing for price to burst out of the resistance for a long-term favorable step. BINANCE:FLMUSDT.P
MEXC:FLMUSDT.P BYBIT:FLMUSDT.P
Make Sure To Have a Exit Plan Too.
I am IN.
Activating Trade.

SOLUSDTSOLUSDT is in strong bullish trend.
As the market is consistently printing new HHs and HLs.
currently the market is being respected by inclining trendline and has also formed bullish flag pattern which is also being supported by inclining trendline.
These two to gather putting strong bullish confluence for the pair.
What you guys think of this idea?

KEYUSDTKEYUSDT is in very strong bullish trend and also formed the bullish flag pattern. Currently the price is forming a support zone with in the flag and if this support holds and price break the flag the next target could be 0.00700.
What you guys think of this idea?

Safe Bulkers: 3 Rising Valleys Into a Bull Flag Bullish BAMM Safe Bulkers has formed 3 Rising Valleys with Hidden Bullish Divergence, and on the 3rd Valley, it seems to have formed a Bull Flag. Once it breaks out of the Bull Flag it will enter a Bullish BAMM that could take it up to the 0.886 all the way up to the 1.13 Extension as it enters an Alternate Bat Bullish BAMM.

DELL bull run started after large consolidationDell after a long consolidation is able to pump and print its first bullish candle with good volumes indicating a bull run about to rake place..
best investment for long run till 130..probably can be achieved in a year.

Bullish Flag | Potential LongChart 1H TF
I realized a Bullish Flag on MAV's chart and it's trading at 0.239x now
BINANCE:MAVUSDT has support around 0.235
Wait a confirmation for Bullish Flag

🚀XRP🚀 The Monthly Flag Pattern 📈📊 The Flag Pattern: The flag pattern is a technical analysis formation that often indicates a continuation of the current trend. It typically consists of a strong price movement (the flagpole) followed by a consolidation phase (the flag) that forms a distinct shape on the chart.
🏁 A Familiar Sight: XRP enthusiasts might feel a sense of déjà vu because the monthly chart is showing signs of yet another flag pattern formation. We've seen this before in XRP's historical price action.
📈 What It Could Mean: The flag pattern is generally considered a bullish continuation pattern. If history repeats itself, this formation might suggest that XRP is gearing up for another bullish run.
🔎 The Importance of Confirmation: While patterns like these can be exciting, it's crucial to remember that technical analysis is just one piece of the puzzle. Confirmation from other indicators and fundamental factors should be considered before making any trading decisions.
🌌 The Crypto Journey: The crypto market is known for its unpredictability, and every move should be approached with caution. Risk management and thorough research are your allies.
In conclusion, the appearance of another flag pattern on the monthly XRP chart is an intriguing development. It hints at the possibility of a new bullish phase, but it's essential to use it as one tool in your analytical toolbox.
Stay tuned, stay informed, and remember - the crypto world is full of surprises, and each chart pattern tells a unique story! 📊🚀
❗See related ideas below❗
Follow + Like this post and share your thoughts in the comments; your engagement fuels the crypto conversation! 💚🚀💚

SYNGENE INTERNATIONALnse:syngene international
current price 940
weekly breakout
flag breakout
great fundamentals
keep on buy for great profits
consolidation breakout
100% buy rating
1st target - 900
