FETUSDTFETUSDT is in very strong bullish trend and also formed the bullish flag pattern. Currently the price is forming a support zone with in the flag and if this support holds and price break the flag the next target could be 0.300.
What you guys think of this idea?
Bullish Flag

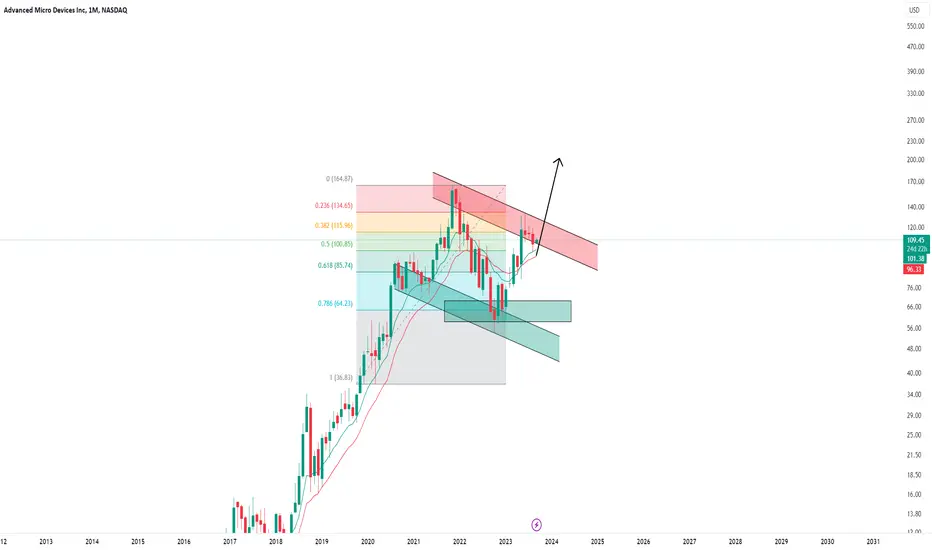
Adv. Micro Dev. (AMD) -> Breakout TimeMy name is Philip, I am a German swing-trader with 4+ years of trading experience and I only trade stocks , crypto , options and indices 🖥️
I only focus on the higher timeframes because this allows me to massively capitalize on the major market swings and cycles without getting caught up in the short term noise.
This is how you build real long term wealth!
In today's anaylsis I want to take a look at the bigger picture on Advanced Micro Devices.
Just 9 months ago - after a quite harsh drop of more than 60% - Advanced Micro Devices perfectly retested the 0.786 fibonacci retracement level and reversed towards the upside.
With the overall trend still being massively bullish I am now waiting for and expecting a bullish breakout of the current flag pattern with my upside target being the previous all time high.
- - - - - - - - - - - - - - - - - - - -
I know that this is a quite simple trading approach but over the past 4 years I've realized that simplicity and consistency are much more important than any trading strategy.
Keep the long term vision🫡
Bullish Flag pattern breakout in MPHASISMPHASIS LTD
Key highlights: 💡⚡
✅On 1Hour Time Frame Stock Showing Breakout of Bullish Flag Pattern.
✅ Strong Bullish Candlestick Form on this timeframe.
✅It can give movement up to the Breakout target of 2600+.
✅Can Go Long in this stock by placing a stop loss below 2415-.

Twilio is consolidatingNYSE:TWLO has a nice bull flag as a falling wedge. If general stock markets continue upward move, then we see a break within a couple of days. Otherwise we may have one another leg down before breaking out.
Disclaimer – WhaleGambit. Please be reminded – you alone are responsible for your trading – both gains and losses. There is a very high degree of risk involved in trading. The technical analysis , like all indicators, strategies, columns, articles and other features accessible on/though this site is for informational purposes only and should not be construed as investment advice by you. Your use of the technical analysis , as would also your use of all mentioned indicators, strategies, columns, articles and all other features, is entirely at your own risk and it is your sole responsibility to evaluate the accuracy, completeness and usefulness (including suitability) of the information. You should assess the risk of any trade with your financial adviser and make your own independent decision(s) regarding any tradable products which may be the subject matter of the technical analysis or any of the said indicators, strategies, columns, articles and all other features.

Gold fill fly morecurrently gold is trading in a bearish wedge pattern n D1 chart.Also it has been reacting for the 1910-1912 very strong resistance and the EMA 200 was supporting for the rejection
the situations like this what we can expect the higher rejection to the upside is possible .if gold trade above 1920 and behave steady above that area will move gold to 1929-30 strong resistance

Nice bullish flagBullish flag formation above broken resistance now support. I has been consolidating since June, the break out will be hard. Wide SL as usual in Forex.

USDJPYUSDJPY is in very strong bullish trend and has break through bullish flag pattern. and it seems like sky is the limit for this pair amid very weak JPY. USDJPY is the best example of Trend is your friend.
What you guys think of this idea?

TRBUSDTTRBUSDT has formed bullish flag pattern and currently the price is trading at previous support zone and also getting support from flag.
if this support holds and flag breakout happens it will be strong bullish leg with target of 14.50 followed by 15.
What you guys think of this idea?

Ibulhsgfin buying opportunityA favorable risk-to-reward ratio opportunity can be seen in this stock which is nearing a breakout from flag pattern with increasing volume support.
Buy Entry - Above 175
Target - 205
Stop Loss - 163

Resuming the ascent.After that extended fall, which didn't actually last long, comes the continuation of the rise or simply the other shoulder of a head and shoulders pattern. I believe what we will see is that where everyone wants it to fall, it won't, and it will continue until completing the massive flag at $380.
The Rollercoaster Ride of Pound AustraliaAs we approach the final week of August, brace yourself for potentially one of the most volatile periods this month. The market is signaling its intentions as I navigate my way through twelve pairs, making the selection process a challenge. Nonetheless, let's dive into the Pound Australia, and I'll even introduce two additional currency pairs for your benefit. 📊💹
Pound Australia reveals an intriguing story on the weekly chart. With new highs being set, the prospect of Pound Australia hitting 2.0000 as a significant milestone isn't far-fetched. The candle's accelerating gradient signifies a robust market movement. 🚀
The daily, four-hour, and one-hour charts echo this bullish trend with broken resistances and new highs. Despite this, you might wonder about the trading opportunity.
In fact, immense profit potential lies in the development of these trades.
For those acquainted with trading, conduct your own analysis on Pound Australia using UTC+3 as your timeframe to align with my insights. And if you seek clarification or wish to share your analysis, the QR code will connect you to our community of like-minded traders. 💬🌐
Returning to the weekly chart, let's unveil why Pound Australia holds importance this week. For those eyeing a shorting opportunity, the completion of the bearish crab pattern at 2.1276 is on the horizon. Although reaching this level, let alone 2.0997, may take some time, the potential is undeniable. Stretching my trade upward could yield significant rewards, with a projected 1,419 pips. However, it's not just about the pips – there's a compelling rationale behind this trade. 📊📉
On the daily chart, buying opportunities beckon when a market retracement occurs and retraces back to 1.9330. Patience is key in engaging these trades. The four-hour chart presents less at the moment unless a trendline retest triggers a definitive level, possibly in the weeks to come rather than the immediate future. 📈📉
Now, onto the exciting prospect – the one-hour chart. This week, a bullish flag pattern will unfold, offering immediate trading opportunities. Engaging this pattern involves meticulous strategy, be it through an aggressive setup with stops below 1.9808 (utilizing my secret formula), waiting for a breakout and subsequent retest, or a blend of both. While seemingly simple, the bullish flag pattern demands a well-thought-out approach to ensure your trade's success. 📊📈
In the realm of the 15-minute chart, where volatility rules, the Pound Australia might be considered insane to some. However, driven by the substantial potential rewards, I'm willing to navigate this territory.
A red eclipse serves as a warning signal for the setup, but immediate buying opportunities at 1.9841 might emerge, especially on a Monday. Keep your eyes peeled for a magic candle confirmation at this level to secure a promising trade. This could be an incredible setup before wrapping up the year. 📈💰

EURJPYEURJPY has formed the bullish flag pattern. Currently the price is hovering around the channel and it seems like the price is ready to break the flag amid weaker JPY.
what you guys think about it ?

CTRM High Tight Bull Flag in Consolidation LONGCT
CTRM jumped about 20% with earnings in my idea published as that was occurring.
It is now in consolidation for two days on the 30 minute chart in what appears to be
a high tight bull flag pattern. These patterns are typically predictive of a bullish continuation
with decent reliability. The continuation can can be as much as the height of the flag
pole which is about 0.13 and so a continuation could be in the neighvborhood of 13/57
or about another 22% higher.
My trading plan is I will buy when price breaks above the flag's parallel channel with a stop
los below the channel. If there is a breakdown I will consider going short with a stop loss above
the parallel channel. Longside my target will be 20%. If I go short, I will target a 50%
retracement and so about 10%. For the time being, CTRM is on my penny-stock watchlist
as a long trade.

Huge Profit over 500% when breakout Bullish FlagWeekly Chart:
Chance to take over 500% for next BullRun
Daily Chart:
Aptos BINANCE:APTUSDT is increasing to $9 and try to breakout Bullish Flag
Chart 2H TF:
Aptos has a small pullback before going up
Short in lower timeframes
Wait and see next move

Bitcoin - Explosive breakout, watch this bull flag!
Bitcoin is forming a bullish flag pattern or a wedge pattern on the daily chart, and that's why we can expect an explosive breakout in the immediate short term! The question is, when is it going to be? I would say this or next week, because the price could still touch the upward yellow trendline. But the decision will be very soon!
Bitcoin is bullish because the price is above the yellow trendline and above the 200-day simple moving average. They are pretty close to each other. This moving average is considered strong support / resistance by huge institutions and hedge funds. It can also be a 200-week MA or a 200-month MA. They are pretty good.
The target of this bullish flag / wedge is the white trendline. Make sure you take profit here because we could crash from this point!
This analysis is not a trade setup; there is no stop-loss, entry point, profit target, expected duration of the trade, risk-to-reward ratio, or timing. I share my trades transparently and post trade setups privately.
Usually September is a bearish month, but we still have almost a month. Bitcoin usually pumps in 1-3 straight candles when no one is expecting it. It can be really fast!
XRP also reached a strong support that can send it to higher prices, specifically 1.7 USDT per coin. It's a good time to buy it!
I remain bullish on BTC, but on the intraday chart, we could still have some imbalance and wicks to take liquidity before going to 32k. Let me know in the comment section what you think about BTC. I look forward to your comments!
Thank you, and for more ideas, hit "Like" and "Follow"!

Bullish Flag, at least 30% profitableDaily chart
Bitcoin Cash BINANCE:BCHUSDT increased over 260% from 10 Jun 2023 and it's trading around 252 now
I spot a Bullish Flag Pattern for next move and it's completing
Need a breakout to confirm that pattern
I'll update

Bitcoin prediction 2028 (Fibonacci channel, must know)!
This is my projection for the next 5 years. Bitcoin always rapidly grows after the halving event. But around 16 months after the halving event, Bitcoin started to crash significantly.
On the chart, we can see a very important Fibonacci channel on the LOG scale. The 0.618 FIB is always a strong level, and bitcoin hit it almost to the dollar in 2022. Take a look at it! We deeply need to keep this Fibonacci channel in mind. The strongest FIB levels are 0.618 and 0.382. 0.618 + 0.382 = 1. Bitcoin loves these Fibos.
Please do not expect some big parabolic phase to reach 500,000 USD in the next few months or years. This is not going to happen because you are too late for the exponential party. 100,000 - 120,000 in 2025 is a realistic target!
Bitcoin is a good investment, and you can trade the major cycles. Buy low, sell high. It's easy to say, but it's not that easy for the majority of market participants.
As per my calculations, the price of Bitcoin will be 1 million USD in 2044, which is 21 years ahead.
In approx. 2140, all Bitcoins should be mined, and there will be no new BTC mined at all. Miners will receive rewards from the transactions of chain users.
This analysis is not a trade setup; there is no stop-loss, entry point, profit target, expected duration of the trade, risk-to-reward ratio, or timing. I share my trades transparently and post trade setups privately.
Thank you, and for more ideas, hit "Like" and "Follow"!
Bear markets and crashes:
2011 - 93.75%
2014 - 86.94%
2018 - 84.22%
2022 - 77.57%
2026 - 71.67% ?

Bullish flag pattern breakout in Dixon TechDIXON TECHNOLOGIES LTD
Key highlights: 💡⚡
✅On 1 Day Time Frame Stock Showing Breakout of Bullish flag Pattern .
✅ Strong Bullish Candlestick Form on this timeframe.
✅It can give movement up to the Breakout target of 6076+.
✅Can Go short in this stock by placing a stop loss below 3730-.

AMD Earnings Bullish 31st July2023Make sure to understand the trade & then make your decisions. AMD looks bullish to me. Ultimately AMD should go to $140
NOTE: DO NOT TRADE OPTIONS

Bitcoin - Falling wedge will send BTC to 32k! (act quickly)
The price of Bitcoin is currently forming a bullish falling wedge pattern, and we are very close to a breakout! Trade it properly.
We can see that the price broke out of the strong horizontal line (at 29500), but the bears are weak and they are not able to continue in the downtrend. What is now likely is that the bulls are going to push the price back above the line and pump bitcoin to 32K! 32k is a strong resistance because of the ascending trendline, so make sure you take profit or open a short when the time comes!
On the way up to 32k, we have some minor resistances, such as the previous unfilled FVGAP and 0.618 FIB retracement. Good for intraday pullbacks, but nothing huge.
This analysis is not a trade setup; there is no stop-loss, entry point, profit target, expected duration of the trade, risk-to-reward ratio, or timing. I share my trades transparently and post trade setups privately.
From the Elliott Wave perspective, we clearly see an overlapping structure in the downtrend. I marked it as WXY (double three pattern). Also, the X wave looks like a triangle, which suggests that the downtrend is almost over.
This is my update on BTC. I expect higher prices for the crypto market in the next few weeks! Alt season is ready, so make sure you buy some altcoins if you haven't already, as per my previous analysis. Set up notifications for my ideas so you will be alerted in your email when I publish new analyses immediately!
What do you think about Bitcoin? Let me know in the comment section; I look forward to your opinions!
Thank you, and for more ideas, hit "Like" and "Follow"!

Quick trade idea on $FCX based on bull flagFCX is bull flagging with a lot of tailwinds that I won't delve into here. Solid long term play worth a couple rolls.

4hr bull pennant on xrpusdI normally don’t put too much faith in 4 hour timeframe chart patterns, however should this 4 hour chart bull pennant hold up the bullish breakout target is around $1.10 . As of now it does look like it’s about to break upward, however being a smaller time frame like the 4hr chart there is still a chance this could be a fakeout and the real chart pattern is much bigger and needs to be charted on a higher timeframe. For now at least this looks good. *not financial advice*

STMX/USDT Big Breakout Bull Flag So 12x Potential from My Entry? STMX/USDT Technical Analysis - Big Bull Flag Breakout Signals Potential 12x Gains!
Greetings, Crypto Traders! Today, we'll dive into a detailed technical analysis of the STMX/USDT trading pair, which has recently witnessed a significant bullish movement. As always, remember to exercise caution and follow proper risk management strategies. Let's explore the charts and identify potential entry and exit zones for maximum profit potential!
Weekly Time Frame Analysis
The STMX/USDT trading pair has just experienced a substantial breakout from a Big Bull Flag pattern on the weekly time frame. This bullish continuation pattern suggests the potential for further upward movement. However, we must exercise patience and avoid chasing the current price surge.
Buy Low, Sell High - Timing Matters
Considering the impressive 276% price surge in just 7 days, it is crucial to refrain from FOMO (Fear Of Missing Out). The smart approach is to wait for a retest of the breakout level before entering a position. Buying during a retest provides a more favorable risk-to-reward ratio and minimizes the risk of buying at the peak.
Best Accumulation Zone
In my opinion, the best accumulation zone lies in the range of $0.0042 to $0.0053. Waiting for the price to reach this zone will increase the likelihood of securing an advantageous entry position.
Long-Term Bullish Sentiment
The breakout from the Bull Flag pattern was accompanied by a significant surge in trading volume, indicating strong buying interest. This adds to the long-term bullish sentiment for STMX/USDT. However, a proper retest is essential to validate the strength of this breakout.
Price Targets and Potential Gains
Upon a successful retest, the next potential target for STMX/USDT lies around $0.060. This ambitious target represents a whopping 12x gain from the entry box. While aiming high is exciting, always remember to take profits along the way and adjust your stop-loss levels to secure your gains.
Critical Levels to Watch
Keep a close eye on the following levels:
Support: $0.0055 and $0.0042
Resistance: $0.0093, $0.025, and $0.058
These levels can offer valuable insights into market sentiment and potential price reactions.
Conclusion
The STMX/USDT trading pair has shown great potential with its recent Bull Flag breakout on the weekly time frame. However, exercising patience and waiting for a retest before entering a position is a prudent approach. Keep an eye on the critical support and resistance levels to gauge market dynamics. Remember, always trade responsibly, and stay informed about the latest market developments.
Happy trading and best of luck in your crypto endeavors!
Disclaimer: This analysis is not financial advice. Trading cryptocurrencies involves risk, and past performance is not indicative of future results. Always conduct your research and consult with a professional advisor before making investment decisions.
Follow us for More Quality Analysis.
