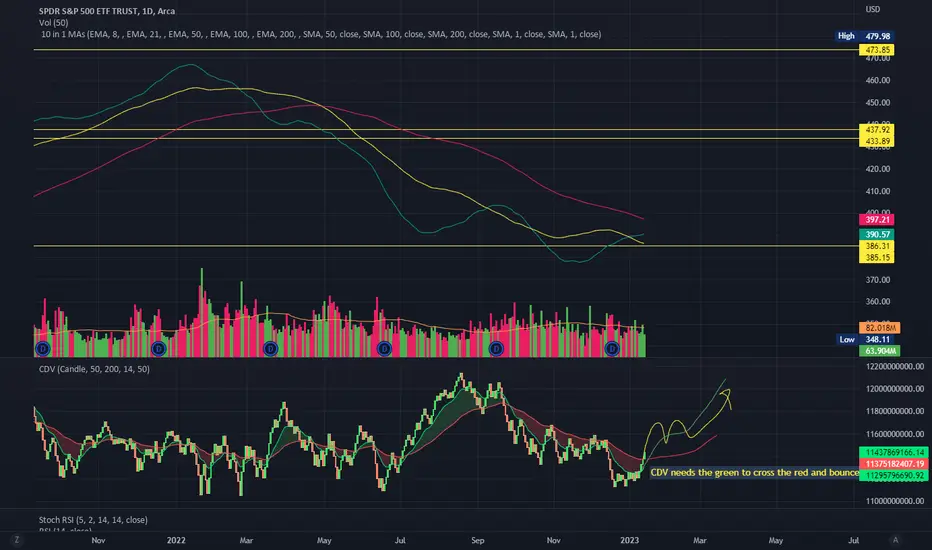
SPY bull market using SMA and CDVIs this a sign of the end of a bear market?
SMA 50 is cutting above SMA 100 and SMA 100 looking flat based on Adam Khoo theory.
The SMA 200 has yet to slope upwards (once this is confirmed upwards new bull market is confirmed).
Some experts believed that in order to signal end of a bear market the VIX has to hit above the reading of 40 before it begins to signal end of bear market.
So far it has not. Let's observe.
Bullish Flag
Bull FLAG for BTC on weeklyI have been posting recently, mostly NON-technical analysis for btcusd. But here is a very easy to spot BULLISH continuation flag.
BTCUSD should expect either one of two scenarios (Technically speaking):
1- Continue through the channel by retracing back to around 25k.
2- Break anytime soon (Refer to my idea about timing : ), to reach 29k, then 33k.
Since, I am expecting bitcoin to gain mainstream support after June 8th, then both are actually possible.
In all cases, By end of June, BTC should finally break out of this channel.

EURAUD I Correction completed from recent impulse - LONG Welcome back! Let me know your thoughts in the comments!
** EURAUD Analysis - Listen to video!
We recommend that you keep this pair on your watchlist and enter when the entry criteria of your strategy is met.
Please support this idea with a LIKE and COMMENT if you find it useful and Click "Follow" on our profile if you'd like these trade ideas delivered straight to your email in the future.
Thanks for your continued support!

NXPI Semiconductors: Bullish ABCD BAMM ProjectionNXPI is trading within a weekly consolidation structure that appears to be bottoming out and preparing to make at least an 0.886 retrace, and recently it has formed a Bull Flag and it has also confirmed Hidden Bullish Divergence on the Monthly with a MACD Bullish crossing.
Out of all the big chip suppliers, NXPI is one that has yet to make any crazy moves up and is still trading within a value area, but that likely wont last long as it catches up with the rest of the sector as it is an active supplier within the sector.

NZD/CADIt is expected that after breaking the dynamic resistance, an upward trend will be formed. Be sure to enter the trade after a valid failure.

TSLA: This is Why it Can Explode (Even More).• TSLA just reached another resistance level, after breaking its previous resistance at $177, as mentioned on my previous public analysis (link below this post);
• Although it just hit another resistance level at $191, there’s no top signal, nor bearish reversal structure on TSLA yet. Even if we see TSLA dropping, the trend would still remain bullish – remember, pullbacks are different than reversals;
• This happens because the trend is still bullish, as TSLA stock is doing higher highs/lows since April 27, and it is clearly above the 21 ema now;
• Any pullback to the $177 area again wouldn’t be the end of the world. In fact, when the trend is bullish, any bullish reaction around a support level must be considered an opportunity to buy/add positions;
• On the weekly chart, TSLA is on the verge of triggering a Flag chart pattern. This pattern wasn’t triggered yet, but if we see an upwards breakout, then we’ll see a long-term bullish reversal pattern getting triggered for the first time since 2021;
• If triggered, this Bullish Flag could easily take TSLA above the $300, long-term speaking;
• TSLA is almost hitting the upper trend line, which is another technical resistance level.
• Therefore, it all depends on how TSLA will react now that it reached its resistance levels, mid-term speaking. So far, no top signal around, and TSLA looks very promising. Let’s keep our eyes open.
I’ll keep you updated on this. Remember to follow me to keep in touch with my daily analysis.

🔥 Litecoin Bull-Flag Break OutLTC has been on a massive move over the last couple of weeks, arguably in anticipation of the LTC halving.
After a week of sideways movement, LTC has finally broken out of the bull-flag pattern and is resuming upwards.
First target at the most recent local top, second target at 100.

BTC/1D : is it making a bullish flag ? It seems to making a bullish flag on the daily chart.
Could we maybe see a 5th leg down , before breaking out ? And perhaps rally back to 1 of the supply zone.
I should wait for a breakout first or a 5th leg down to get more confirmation .

GBPNZD I Impulse flag and continuation
Welcome back! Let me know your thoughts in the comments!
** GBPNZD Analysis - Listen to video!
We recommend that you keep this pair on your watchlist and enter when the entry criteria of your strategy is met.
Please support this idea with a LIKE and COMMENT if you find it useful and Click "Follow" on our profile if you'd like these trade ideas delivered straight to your email in the future.
Thanks for your continued support!

ED - Bullish FlagED has shown structural similarities to that of a bullflag
It is showing also a W type structure that will lead to a breakout of the right arm of the W, supporting the bullflag theory
Breakout?

Hex 30% gains incoming...Measured move suggest a30% move to the upside, there are also other layers of multiple confluence but we will save that for another day ...

🔥 Bitcoin Bearish Channel: Break Out On Banks Failing?In my latest BTC analysis I talked about the bearish channel in which Bitcoin was trading. My expectation was a move downwards, since the market looked more bearish than bullish.
After a quick drop, BTC recovered again on regional banking failures.
With yesterday's FOMC meeting rising the interest rates by another 0.25%, the risks of more (regional) banks becoming insolvent has only increased. This is good news for Bitcoin because people will take out their money from banks and store it in BTC (or gold, for that matter).
We can break out of the channel today, making it a bull-flag pattern. Looking at 30k and 31k in the short-term in case the bullish pressure persists. Be patient for the break out. Also note the blue dotted support line, which can be retested in the near future.

W10-USDNOK BULLISH IDEAPOTENTIAL BULLISH ENTRY
Dow Theory In Place - higher highs and higher lows Expected in Place (Trend continues)
Formation of the bullish flag (continuation pattern)
ENTRY, SL & TP Levels are defined.

Critical Support Level Identified for GBPUSDOn closer analysis of the GBPUSD on a higher timeframe, it is evident that the candlestick has closed above the previous high, thereby confirming the bullish trend of the currency.
However, one must exercise caution before diving in, as the current market price is currently situated on the weekly chart supply zone, which traditionally indicates a sell zone.
Nevertheless, my outlook remains bullish on the GBPUSD, and I plan to take a measured approach by waiting for the market to retrace back to 1.2500 and watch out for a Double Bottom on the 1-hourly chart before making any trading decisions.
This strategy will enable me to minimize risk while maximizing potential returns.

CAR - Strong Bullflag Above ChannelA strong bullflag has formed
Currently it is above some major trend lines so ill assume it will breakout above these lines, as indicated by the bars pattern
Daily chart
The bullflag is in the channel.

BTC forms Bullish flag with pinsBull Flag made and pins started, need to see one more pin to confirm this, Then I see 45K as a top of this run before a support confirmation later, If we do not see the 3rd pin form then this could be traping more longs and then down we go. BTC has been all over the place so we have to keep our eyes on the news and charts every 4 hours, I Love seeing the volatility come back, This is where we make money, going short and long. Remember down trends are great money-makers for short orders. Let's see how these next 4 hours play out. God Speed.

W9.1-40 GBPAUD BULLISH IDEA(BULLISH FLAG)POTENTIAL BULLISH ENTRY
Dow Theory In Place - higher highs and higher lows Expected in Place (Trend continues)
Formation of bullish flag coupled (continuation pattern)
SL & TP Levels are defined.

TNYA Biotechology Penny NASDAQ LONGTNYA has been in consolidation the past two days being in the flag of
a bull flag pattern on the 1H chart. Earnings about six weeks ago were
solid especially for a biotechnology stock which are generally priced
based on future potential and not current performance.
( Fundamentally TNYA is in the gene splicing /slicing place which is
perhaps the most lucrative and therapeutic of all of the various
areas in the biotechnology realm. Seemingly, its potential is
expodentially high. )
The zero lag MACD lines have crossed under the histogram which in
general can be considered as a buy signal. The histogram has flipped to
positive.
Upside to the overhead resistance zone by the Luxalgo indicator
is from an entry of about 5 to 6 or about 20%.
Very recent high relative volume as compared with
the 50 day moving average further supports a long trade at this
time. The stop loss would be $.02 below the POC line of the
volume profile.
I will play this with options to further leverage the price action.
Both options and stock are inexpensive for a small account.

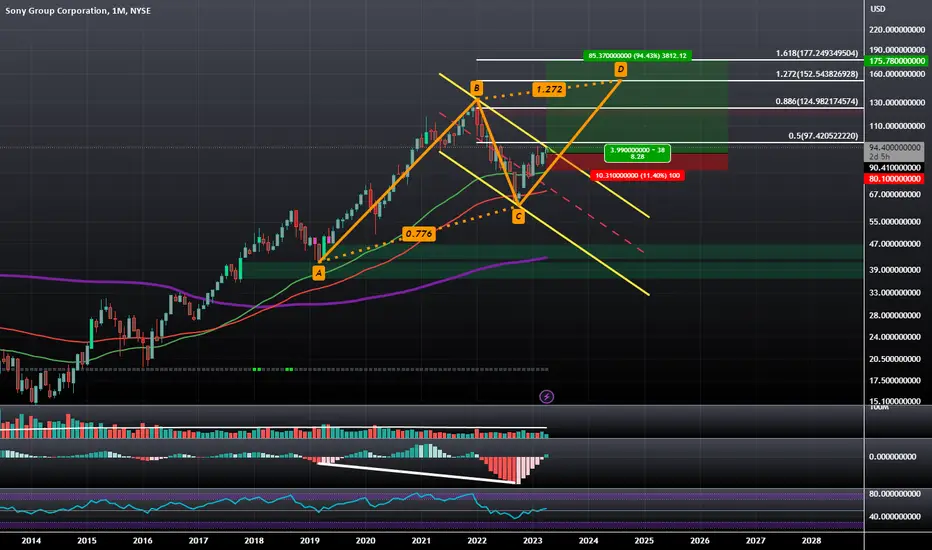
$SONY: Monthly Hidden Bullish Divergence and Channel Breakout NYSE:SONY on the Monthly Timeframe is breaking out of a Descending Channel while confirming Hidden Bullish Divergence and Bullishly Crossing over on the MACD and the RSI enters the Bullish Control Zone; the next obvious target would be between 150 and 177 Dollars as that would be the completion of an AB=CD Harmonic Pattern. One last thing to note on the side is that the NASDAQ:MSFT acquisition of NASDAQ:ATVI has recently hit a brick wall with regulators and this is likely to spur some optimism in the NYSE:SONY camp who has opposed this acquisition in fears that Microsoft would eventually make games like Call of Duty, Xbox Exclusive.
xauusd Gold buy setup possible hello traders gold has shifted the tide there is a buy pressure may be a new high on gold because what is going on the fiat currency also the daily the weekly also the monthly suggests bullish condition we have a flag pattern but it can easily be a triangle but now i see this lets see how it play out always wait the candle to close after the breakout ,

W9.1-32GBPJPY BULLISH IDEA (BULLISH FLAG & DOUBLE BOTTOM)POTENTIAL BULLISH ENTRY
Dow Theory In Place - higher highs and higher lows Expected in Place (Trend continues)
Formation of bullish flag coupled (continuation pattern) and double bottom coupled with bullish divergence
SL & TP Levels are defined.

45% Vs 57%Yes, we are in the middle of something, let me explain.
we have a well formed rising wedge that is a bearish pattern, inside of an giant bull flag in theory we should se that pattern ending but that pattern is inside of 3 symmetrical triangles, one confirmes another 2 close to be confirmed, the symmetrical triangle is a reversal confirmation, so we should see a continuation for the uptrend.
Green arrow point to the symmetrical triangles
Blue arrow point to the giant bull flag
Orange point to the wising wedge
If for some reason the rising wedge was the winner the next week, could take us 45% down from here.
But if the symmetrical is the right pattern and we are watching a trend change, we should see to complete the bull flag with more than 50%.
I think that because the giant bull flag is too old, the symmetrical triangles are dominant and we should se the up trend continuation.

Beautiful Buy Setup - Bullish Flag Pattern USD/JPY A very clean buy setup has presented itseld on USD/JPY. We can see a clear bullish flag pattern form right within a discounted Fibonacci retracement zone. We can also see price is respecting the 78.60% very nicely & the lower region of the flag pattern trendline.
