BTC is in an ascending triangle and we are an upward movement.Bitcoin is currently in an ascending triangle pattern, which is a bullish continuation pattern in technical analysis. This suggests that buyers are gaining strength and there is a high probability of an upward breakout. The fact that we're already seeing an upward movement supports the idea that a new uptrend may be starting.
In short:
Bitcoin is forming an ascending triangle, and we're witnessing an upward price movement, which could signal the beginning of a stronger bullish trend.
Bullish Flag

XAUUSD Breakout from Bullish Flag – Eyes on $3,387Gold (XAUUSD) on the 1H timeframe is exhibiting a strong bullish continuation setup, supported by multiple confluences that suggest the uptrend is far from over. The chart clearly shows the market breaking out from a Bullish Flag Pattern, respecting curve support, and targeting the major resistance zone near $3,387.
🔍 Technical Breakdown:
1. Bullish Flag Pattern Formation
After a sharp bullish impulse, price consolidated in a tight downward-sloping channel — the classic bullish flag. This pattern typically appears mid-trend and signals a healthy pause before the next leg higher. The breakout from the flag confirms bullish continuation, often offering a high-probability trade entry.
2. Break of Structure (BOS)
The breakout above minor resistance marked a Break of Structure (BOS), which is a key bullish signal. It indicates a shift in market sentiment and validates the end of the corrective phase (flag) and beginning of the next impulse wave.
3. Curve Support (Parabolic Trajectory)
A parabolic curve support is now guiding price upward, showing increasing bullish pressure and higher lows forming consistently. This type of dynamic support often appears in strong trending markets where buyers step in aggressively at every pullback.
4. Liquidity Sweep & Smart Money Behavior
Before the breakout, price dipped below recent lows within the flag, likely sweeping liquidity and triggering stop-losses. This move provided institutional players with the liquidity needed to push price higher — a classic smart money trap-and-break scenario.
5. Volume & Momentum Confirmation
The breakout occurred with strong bullish momentum and rising volume (if checked on the volume profile), reinforcing the credibility of this move. A momentum-based continuation is likely as long as price remains above previous resistance (now support).
🎯 Target & Resistance Levels:
Short-Term Target: $3,387 — aligned with the previous major resistance area
Support Zone: $3,260–$3,275 (previous flag breakout + structure support)
Major Resistance Zone: Around $3,360–$3,387 (historical supply zone)
🧠 Trade Idea / Strategy:
As long as price holds above the curve support and retests the previous breakout zone (flag top or minor resistance), bullish entries on pullbacks are favored.
✅ Buy on dips into curve support or minor resistance retests.
❌ Avoid shorting into a strong parabolic structure unless signs of exhaustion appear.
🎯 Potential RR setups: 1:2 and beyond if entry is timed well.
💬 Conclusion:
The market structure, pattern confirmation, and strong bullish momentum all point toward a continuation move toward the $3,387 level. This setup provides a solid technical case for bullish trades with multiple entry options and well-defined risk levels. Keep an eye on curve support and potential higher timeframe resistance reactions for dynamic trade management.

XAUUSD – Bullish Flag Breakout & Black curve Line | Target Gold (XAUUSD) is currently shaping a textbook bullish flag pattern on the daily chart, signaling a potential continuation of the strong uptrend that started late last year. This setup, when combined with the custom-drawn Black Mind Curve, provides a structured and disciplined approach for identifying entry, retest, stop loss, and profit targets. Let’s break it down in detail:
🔍 1. Flagpole: The Impulse Move
The rally from around $2,550 in December 2024 to nearly $3,330 in April 2025 formed a steep and aggressive uptrend, which now serves as the flagpole of our pattern.
This impulsive wave represents strong buying momentum and is the backbone of the entire bullish flag structure. It shows institutional interest and heavy volume participation in gold, likely driven by macroeconomic factors such as inflation hedging, USD weakness, or geopolitical uncertainty.
🔷 2. Bullish Flag: The Consolidation Zone
Following the peak, gold entered a consolidation phase, forming two parallel descending trendlines, indicating healthy profit-taking and temporary market indecision. This is not a reversal but rather a pause in the trend, often seen before the next leg higher.
This down-sloping consolidation resembles a flag pattern—a reliable bullish continuation formation where the price temporarily contracts before a breakout.
The flag pattern is still valid as long as price remains inside or breaks above the upper boundary with momentum.
📈 3. Breakout Signal and Retesting Level
As of now, price is testing the upper boundary of the flag. A bullish breakout is anticipated once price closes above the $3,300–$3,350 resistance zone.
Following the breakout, a pullback to retest this same level is expected, forming a new support zone—a classic "breakout–retest–rally" setup.
💡 Retest Zone:
$3,300 to $3,350
This is your key zone to watch for confirmation. A bounce here could offer the best risk-reward entry.
🛡️ 4. Stop Loss Placement: Protecting Your Capital
To manage risk effectively, the stop loss should be placed below the lower boundary of the flag, and ideally just under the psychological round number at $2,970.
This protects your trade from a false breakout or sudden trend reversal while keeping the risk/reward ratio favorable.
🎯 5. Target Projection: Measured Move Strategy
We use the height of the flagpole (approximately $750) and project it upward from the breakout point to estimate the target price.
📌 Target Level:
$4,318 (approx.)
This aligns with technical confluence and psychological resistance above the $4,300 level.
If momentum remains strong and the macro environment continues to support gold prices, this level is a very realistic short-to-medium-term target.
🧠 6. The Black Mind Curve: A Unique Trend Framework
The chart features a custom “Black Mind Curve”, a smooth parabolic line following the overall trend structure. This curve acts as a visual guide for trend strength, suggesting that gold is respecting a higher time frame uptrend trajectory.
It helps reinforce that the bullish structure is still intact—even during short-term pullbacks—by mapping the psychological rhythm of market participants.
This curve is especially useful for swing traders who need to maintain conviction during consolidations.
🧠 Trading Psychology (Mind Framework):
"Charts show the facts; your mind interprets the truth."
Here’s the psychological approach for this trade:
Recognize the Setup: Bullish flag is forming—observe, don’t rush.
Wait for Confirmation: Let price break out and retest—avoid FOMO.
Act on Logic: Enter with defined stop and target—keep emotions out.
Stay Disciplined: Don’t move stop loss irrationally—trust your setup.
Let the Market Work: Once the trade is active, manage it calmly.
🔁 Summary of Trade Plan:
✅ Entry: On confirmed breakout and successful retest of $3,300–$3,350
✅ Stop Loss: Below $2,970
✅ Target: $4,318
✅ Pattern Type: Bullish Flag + Trend Curve Support
✅ Risk-Reward Ratio: ~1:3+ (Ideal setup)
📝 Final Thoughts:
This is a high-probability bullish continuation pattern supported by strong technical structure and psychological market behavior. The breakout is likely to attract institutional flows, especially if it aligns with fundamental tailwinds like falling interest rates or rising inflation.
Stay patient, wait for the retest confirmation, and trade with discipline. Gold is poised for a potential new leg higher—and this setup provides a structured roadmap to ride that move confidently.

ETH/USDT: BULL FLAG BREAKOUT!!🚀 Hey Traders! 👋
If you’re finding value in this analysis, smash that 👍 and hit Follow for high-accuracy trade setups that actually deliver! 💹🔥
🔥 #ETHUSDT UPDATE – Ready for the Next Leg?
ETH surged nearly 48% recently and is now consolidating inside a clean parallel channel. After a healthy sideways move, price is starting to push the upper resistance again — a breakout from here could trigger the next rally phase! 🚀
🔸 Pattern: Bullish Flag/Parallel Channel
🔸 Current Structure: Post-pump consolidation
🔸 Watch for: Break above the upper yellow line for confirmation
🔸 Targets: $2,750 – $2,880+
🔸 Invalidation: Break below channel support and $2,430
📈 If bulls hold this zone, we could witness another explosive move! Keep it on your radar.
💬 What do you think? Is ETH gearing up for a breakout? Drop your thoughts below!
📌 Follow for more high-probability setups!

PIXEL Breakout Alert: Ready for the Next Leg Up?🚀 PIXEL Breakout Alert – 100% Potential Incoming?! 👀🔥
Hey Traders! If you're all about high-conviction plays and real alpha, smash that 👍 and tap Follow for more setups that actually deliver! 💹💯
PIXEL has broken out from a bull flag on the 4H timeframe after consolidating for weeks. This clean breakout signals a potential trend reversal with strong upside momentum building. 💥
Trade Setup:
👉 Entry: $0.0380–$0.0400 (post-breakout zone)
🎯 Targets:
$0.0455
$0.0520
$0.0630
$0.0770
🛡 Stop-loss: $0.0360 (below channel re-entry)
Why I Like It:
Clear breakout of the falling channel
Strong volume surge confirms momentum
Previous 100% move shows solid potential
If BTC stays stable, this one looks set for a strong run! 🚀 Keep it on your radar.

Mastering chart patterns - How to use them in trading!Chart patterns are visual formations created by the price movements of a financial asset—like a stock, currency, or cryptocurrency, on a price chart. Traders use these patterns in technical analysis to predict future market direction based on historical behavior. The main chart patterns are the reversal and continuation patterns.
-------------------------------
What will we discuss?
- Bullish reversal patterns
- Bearish reversal patterns
- Bullish continuation patterns
- Bearish continuation patterns
-------------------------------
Bullish reversal patterns:
Double bottom
A double bottom in trading is a bullish reversal pattern that signals the potential end of a downtrend and the beginning of an uptrend. It forms when the price of an asset falls to a low, bounces back up, then drops again to roughly the same low before rising once more. This creates a "W" shape on the chart.
How to trade it:
Before entering a trade, wait for the price to break back above the neckline with strong volume, as this indicates a potential bullish reversal. Once the breakout is confirmed, look for an entry on the pullback to the neckline.
Inverted head and shoulders
An inverted head and shoulders is a bullish reversal pattern that typically forms after a downtrend and signals a possible shift to an uptrend.
It consists of three parts:
* The left shoulder, where the price makes a low and then bounces.
* The head, which is a deeper low followed by another bounce.
* The right shoulder, a higher low similar in level to the left shoulder.
How to trade it:
Before entering a trade, wait for the price to break above the neckline with strong volume, as this confirms the pattern and signals a potential upward move. After the breakout, it's important to wait for a retest of the neckline to look for an entry. Traders typically place a stop-loss just below the right shoulder to manage risk.
Falling wedge
A falling wedge is a bullish chart pattern that often signals a potential reversal or continuation of an uptrend, depending on where it forms in a price trend.
It appears when the price is moving lower but within a narrowing range, creating two downward-sloping, converging trendlines. Both the highs and lows are falling, but the lower highs are coming down faster than the lower lows, which shows that selling pressure is losing strength over time.
How to trade it:
Wait for the falling wedge to break above the downward trendline and for the price to reclaim the most recent lower high. A breakout alone isn’t always reliable, sometimes the price moves briefly above the trendline without making a higher high, resulting in a fake-out. To confirm the move, wait for a clear higher high and then look to enter on the retracement that follows.
-------------------------------
Bearish reversal patterns
Double top
A double top is a bearish reversal pattern that signals a potential shift from an uptrend to a downtrend.
It forms when the price reaches a high, pulls back, then rallies again to the same or similar high but fails to break above it. This creates an "M" shape on the chart. The neckline is the support level at the low point between the two peaks. When the price breaks below this neckline with strong volume, it confirms the pattern and suggests that selling pressure is taking over.
How to trade it:
Before entering a trade, wait for the price to break below the neckline with strong volume, as this indicates a potential bearish reversal. Once the breakout is confirmed, look for an entry on the pullback to the neckline.
Head and shoulders
A head and shoulders is a bearish reversal pattern that typically forms after an uptrend and signals a potential shift to a downtrend.
It consists of three peaks:
* The left shoulder, where the price rises and then falls.
* The head, which is a higher peak followed by another decline.
* The right shoulder, a lower high that is roughly equal in height to the left shoulder.
How to trade it:
Before entering a trade, wait for the price to break below the neckline with strong volume, as this confirms the pattern and signals a potential downside move, After the breakout, it’s important to wait for a retest of the neckline to look for an entry. Traders typically place a stop-loss just above the right shoulder to manage risk
Rising wedge
A rising wedge is a bearish chart pattern that often signals a potential reversal or continuation of an downtrend, depending on where it forms in a price trend.
It appears when the price is moving higher but within a narrowing range, creating two upward-sloping, converging trendlines. Both the highs and lows are rising, but the highs are increasing at a faster rate than the lows. This suggests that buying pressure is weakening over time, and the market may be preparing for a downturn.
How to trade it:
Wait for the rising wedge to break below the upsloping trendline and for the price to reclaim the most recent high low. A breakout alone isn’t always reliable, sometimes the price moves briefly below the trendline without making a lower low, resulting in a fake-out. To confirm the move, wait for a clear lower low and then look to enter on the retracement that follows.
-------------------------------
Bullish continuation patterns
Bullflag
A bull flag is a continuation pattern that signals the potential for a price to continue moving upward after a brief consolidation or pullback.
It forms when the price experiences a strong upward move (the flagpole), followed by a period of consolidation or a slight downward movement (the flag). The flag typically slopes downward or moves sideways, and the consolidation phase usually occurs within two parallel trendlines, creating a rectangle or slight downward channel.
How to trade it?
Before entering a position, wait for the price to break above the downsloping trendline and establish a higher high. If the price doesn’t make a higher high, it could be a fake-out. Once a higher high is confirmed, look for an entry on the retracement. The target is typically the length of the flagpole projected upward from the breakout point.
Bullish pennant
A bullish pennant is a continuation pattern that indicates the potential for a price to continue its upward trend after a brief consolidation. It forms when a strong upward move (the flagpole) is followed by a period of consolidation, where the price moves within converging trendlines, creating a small symmetrical triangle or pennant shape. The consolidation typically shows lower highs and higher lows, and the pattern suggests that the market is taking a "breather" before continuing its upward momentum.
How to trade it?
Before entering a position, wait for the price to break above the downsloping trendline and establish a higher high. If the price doesn’t make a higher high, it could be a fake-out. Once a higher high is confirmed, look for an entry on the retracement. The target is typically the length of the flagpole projected upward form the breakout point.
Ascending triangle
An ascending triangle is a bullish continuation pattern that typically forms during an uptrend, signaling that the price is likely to continue moving higher.
It is characterized by a horizontal resistance line at the top, formed by a series of peaks at roughly the same price level, and an ascending support line at the bottom, formed by higher lows. This creates a triangle shape, where the price is gradually compressing between the horizontal resistance and the rising support.
How to trade it?
Before entering a position, wait for the price to break above the horizontal resistance level with strong volume. Once the breakout occurs, look for an entry on the retracement back to this area.
-------------------------------
Bearish continuation patterns
Bearflag
A bear flag is a bearish continuation pattern that suggests the price is likely to continue moving downward after a brief consolidation or upward pullback.
It forms when there is a strong downward move (the flagpole), followed by a period of consolidation or slight upward movement (the flag). The flag typically slopes upward or moves sideways, and the consolidation occurs within two parallel trendlines, creating a rectangular or upward-sloping channel. This pattern shows that, despite the short-term pullback, the overall downtrend remains intact.
How to trade it?
Before entering a position, wait for the price to break below the upsloping trendline and establish a lower low. If the price doesn’t make a lower low, it could be a fake-out. Once a lower low is confirmed, look for an entry on the retracement. The target is typically the length of the flagpole projected downward for the breakout point.
Bearish pennant
A bearish pennant is a bearish continuation pattern that signals a potential continuation of a downtrend after a brief consolidation.
It forms when there is a strong downward move (the flagpole), followed by a period of consolidation where the price moves within converging trendlines, creating a small symmetrical triangle or pennant shape. The consolidation typically shows lower highs and higher lows, indicating that the price is taking a pause before continuing its downward movement.
How to trade it?
Before entering a position, wait for the price to break below the upsloping trendline and establish a lower low. If the price doesn’t make a lower low, it could be a fake-out. Once a lower low is confirmed, look for an entry on the retracement. The target is typically the length of the flagpole projected downward for the breakout point.
Descending triangle
A descending triangle is a bearish continuation pattern that typically forms during a downtrend, indicating that the price is likely to continue moving lower after a period of consolidation.
The pattern is characterized by a horizontal support line at the bottom, formed by a series of lows at approximately the same price level, and a descending resistance line at the top, formed by a series of lower highs. The price contracts between these two trendlines, creating a triangle shape with a downward-sloping upper boundary and a flat lower boundary.
How to trade it?
Before entering a position, wait for the price to break below the horizontal support level with strong volume. Once the breakout occurs, look for an entry on the retracement back to this area.
-------------------------------
Thanks for your support.
- Make sure to follow me so you don't miss out on the next analysis!
- Drop a like and leave a comment!

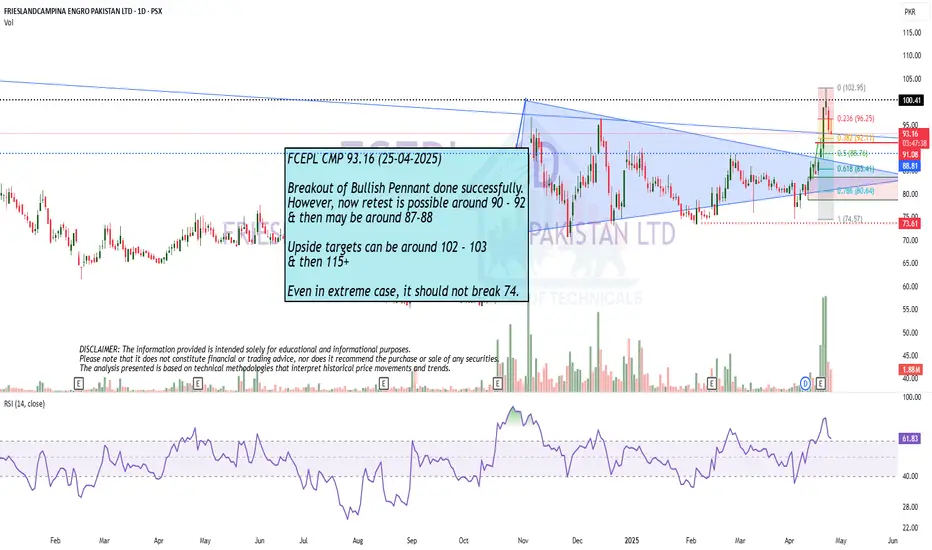
Breakout of Bullish Pennant done successfully.
Breakout of Bullish Pennant done successfully.
However, now retest is possible around 90 - 92
& then may be around 87-88
Upside targets can be around 102 - 103
& then 115+
Even in extreme case, it should not break 74.
ENJ Spike 63% Gearing For 300% Surge Amidst Bullish Flag PatternThe price of Enjin coin ( NYSE:ENJ ) broke out of a bullish flag pattern surging 63% for the past 24 hours. With growing momentum, the asset is gearing for a 300% breakout.
One key factor contributing to the surge is the launch of the Enjin NFT SDK, which enables seamless integration of non-fungible tokens (NFTs) into various platforms, paving way for NFT's on the ENJ ecosystem.
As of the time of writing, NYSE:ENJ is up 19% setting the course for a 300% breakout. The asset has formed a perfect bullish flag pattern with the ceiling of the pattern already broken, NYSE:ENJ will be aiming for the $0.32 resistant and beyond.
With growing momentum as hinted by the RSI at 71.89, NYSE:ENJ might just be the asset to look out for this week.
What is Enjin ( NYSE:ENJ )
Enjin is a blockchain platform that makes it easy for developers to integrate NFTs and digital assets into their games and apps.
The platform provides tools for creating wallets, minting tokens, and managing transactions without requiring users to understand complex blockchain technology.

EURJPY still bullish view
OANDA:EURJPY first analysis attached, in new analysis, we have new structures created (BULLISH FLAG, ZONE, TREND LINE), both pairs dominant in market, personally here still bullish i am.
SUP zone: 160.350
RES zone: 163.400, 164.100

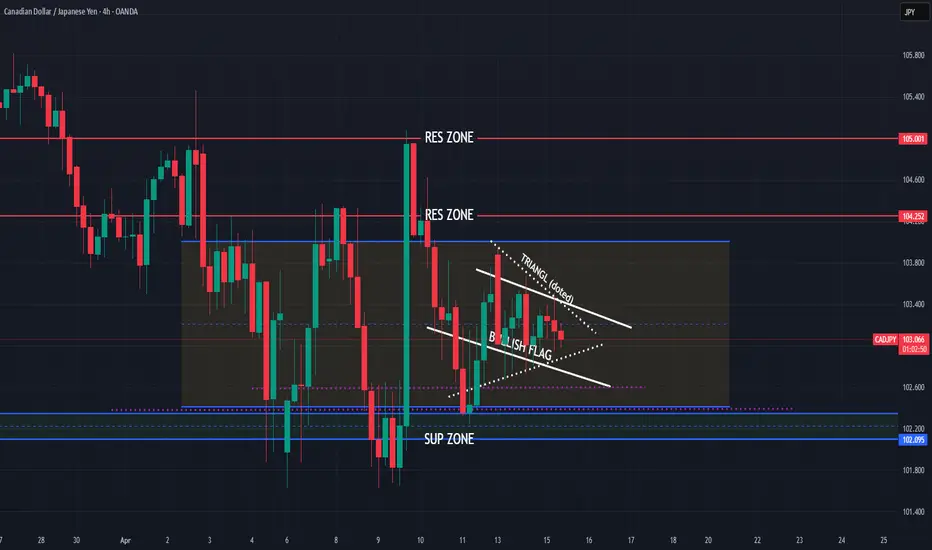
CADJPY structures created, having bullish view
Coming again on OANDA:CADJPY , analysis before this one closed manually, now having batter situation and sharing new view based on price action and patterns.
Few times price is bounce on zone 102.450. Now we have BULLISH FLAG (better visible on 2,1H TF) and we have TRIANGL formation, tomorrow BAC rate cut and some pairs like EUR and GBP versus CAD looks like will go bearish.
View is here bullish for this week.
SUP zone: 102.400
RES zone: 104.250, 105.000
EUR/USD - Bull Flag Pattern Breakout in ProgressThis EUR/USD 1-hour chart showcases a classic Bull Flag Pattern , a strong continuation formation indicating the potential for further upside momentum.
- The pair experienced a sharp bullish impulse move, forming the flagpole.
- The price then entered a consolidation phase within a downward-sloping channel, forming the flag.
- A breakout above the upper trendline of the flag could confirm a continuation of the uptrend.
Traders should monitor key resistance levels and volume confirmation upon breakout. A successful retest of the flag's resistance as new support could provide a strong buying opportunity, with the next target potentially aligning with the flagpole’s measured move projection.
As always, apply risk management and consider additional confluences such as Fibonacci levels, moving averages, or fundamental factors.

EUR/USD – Bullish Flag Pattern & Trade SetupTechnical Analysis & Trade Plan for TradingView Idea
This chart illustrates a Bullish Flag Pattern on the EUR/USD 1-hour timeframe, suggesting a potential continuation of the prevailing uptrend. Below is a detailed breakdown of the market structure, key levels, and a professional trading strategy.
📌 Chart Pattern: Bullish Flag Formation
The Bullish Flag is a continuation pattern that forms after a strong upward price movement, followed by a short period of consolidation within a downward-sloping channel. It signals a brief pause before the trend resumes.
Flagpole: The sharp price increase before the consolidation.
Flag: The corrective downward movement forming a small parallel channel.
Breakout Potential: A confirmed breakout above resistance could lead to a further bullish rally.
🔍 Key Technical Levels & Market Structure
🔵 Resistance Level (Supply Zone)
The upper boundary of the flag pattern acts as resistance.
A breakout above this level could trigger a strong buying opportunity.
🟢 Support Level (Demand Zone)
The lower boundary of the flag provides support.
Price is currently testing this zone, which is a critical decision point.
🎯 Target Price: 1.14544 (Projected Move)
The price target is calculated based on the height of the flagpole added to the breakout point.
This aligns with a previous significant resistance area.
📈 Trading Strategy & Execution Plan
✅ Entry Criteria:
A confirmed breakout above the flag's resistance level with a strong bullish candlestick.
Increased trading volume supporting the breakout.
🚨 Risk Management:
Stop Loss: Placed below the support zone of the flag to manage risk in case of a false breakout.
Take Profit Target: At 1.14544, aligning with the measured move of the flag pattern.
📊 Trade Confirmation Indicators:
RSI (Relative Strength Index): A reading above 50 confirms bullish momentum.
Moving Averages (50 EMA/200 EMA): A bullish crossover would strengthen the buying signal.
Volume Analysis: A breakout should be accompanied by high trading volume for confirmation.
⚠️ Potential Risks & Alternative Scenarios
Fake Breakout: If the price breaks out but lacks volume, it could be a false signal.
Bearish Reversal: If price breaks below the support zone, the bullish flag setup becomes invalid.
Market Sentiment Shift: Unexpected news events can impact price movement.
📝 Summary
The EUR/USD pair has formed a Bullish Flag Pattern, signaling a possible continuation of the uptrend.
A breakout above the resistance level would confirm the pattern and provide a strong buying opportunity.
Risk management is essential, with a stop loss placed below the support level.
Final Target: 1.14544, based on the flagpole’s measured move.
💡 Conclusion: A well-structured breakout above resistance could lead to a bullish rally toward 1.14544. However, patience and confirmation are key before entering the trade.

GOLD in a Bullish Flag – Breakout Incoming?OANDA:XAUUSD is undergoing a corrective move as it tests the lower boundary of the ascending channel, which serves as dynamic trendline support. The structure aligns with a bullish flag formation, indicating the potential for a continuation to the upside if buyers step in.
A successful rebound from this level could lead to a move toward the midline of the channel, with the next target at 3,100, aligning with the upper boundary of the channel. This scenario would preserve the broader bullish trend.
A confirmed breakdown below the trendline support, however, would invalidate the bullish outlook and open the door for further downside.
Monitoring candlestick patterns and volume at this critical zone is essential for identifying buying opportunities. Proper risk management is advised, always confirm your setups and trade with solid risk management.
If you have any thoughts on this setup or additional insights, drop them in the comments!

GBP/USD Bullish Channel – Buy Opportunity! Overview:
The British Pound (GBP) against the US Dollar (USD) is currently trading within an ascending channel on the 4-hour timeframe. The price is approaching a key buy zone at the lower trendline, presenting a potential long opportunity if bullish momentum continues.
Key Market Structure Analysis:
🔹 Uptrend in Progress: GBP/USD has been forming higher highs and higher lows inside a well-defined rising channel.
🔹 Support Zone: A potential buy entry is around 1.2925, aligning with the lower boundary of the channel.
🔹 Target Projection: If the price bounces from support, the next key resistance target is 1.3085.
Potential Trade Setup:
✅ Bullish Scenario:
A retest and bounce from 1.2925 could trigger a buy setup.
Upside target:
🎯 1.3085 – Key resistance level within the channel.
⚠️ Bearish Scenario (Invalidation):
A break below 1.2925 could invalidate the bullish setup and signal a deeper retracement.
Below the channel support, price might target the 1.2600 region as the next demand zone.
Final Thoughts:
GBP/USD remains in a strong uptrend, with the lower channel support acting as a key decision point. If bulls defend this level, we could see further upside momentum. However, a breakdown of the structure could shift the sentiment.
Will GBP/USD continue its bullish momentum? Share your thoughts below!

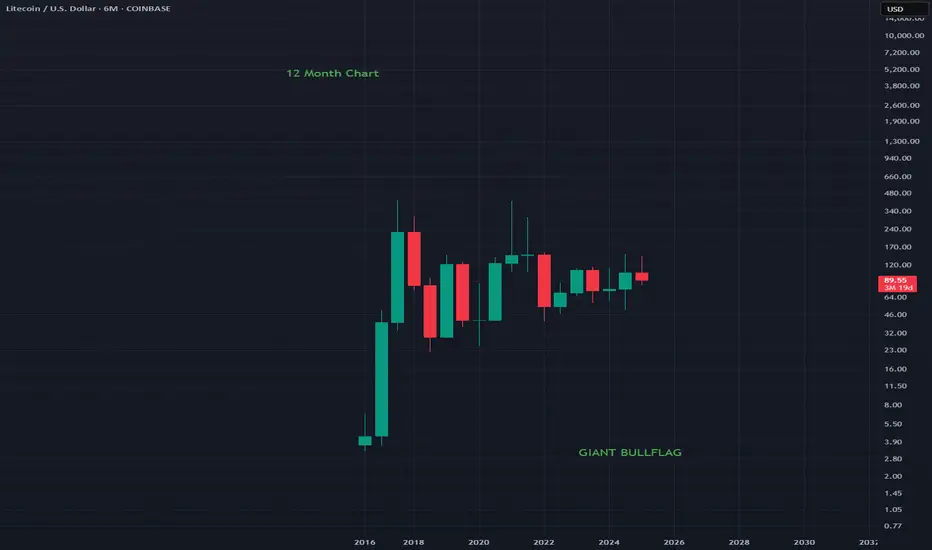
LTCUSD - 12 Month Chart Litecoin has produced a beautiful Bullflag on the 12 Month chart
Its honestly crazy how great this looks on a yearly timeframe
If you want to go very very long this is a great option
MASSIVE BULLFLAG
Could Cardano Bulls "Raise The Flag" To $2??COINBASE:ADAUSD has some very interesting Price Action happening with the decline starting from beginning of December 2024 forming what looks to be a Descending Channel with the potential to become a Bull Flag!
With a Bull Flag being a Continuation Pattern, we can expect a higher probability of a Bullish Break to this Channel to continue in the trend it was following prior to falling into this Consolidation Period.
Last week we saw a huge Bullish Candle form and Break the Channel after testing the March 2024 Highs, the 200 EMA @ .7719, along with the Linear Regression or "True Trendline" of the Descending Channel.
Other indicators suggest Bullishness as well with the RSI staying above 50 in Bullish Territory and we can see a large amount of Volume entering this Weekly Candle with 2 days and 19 hours left until Close at the time of publishing.
*If Cardano can continue to find Support and is able to make a Valid Bullish Break of this Channel, based off the "Flagpole" or Rally, prior to price falling into Consolidation, we can expect a potential 120% gain from the Break, potentially sending price up to test the overhead Resistance Zone in the ( $1.85 - $2.15 ) Range!
3/7 - The White House will be holding the very first U.S. Crypto Summit to make plans to start bringing cryptocurrency into a U.S. Crypto Strategic Reserve
www.tradingview.com

Gold (XAUUSD) Breakout Setup – Targeting $3,014Gold is showing strong bullish momentum on the 1H timeframe, forming a breakout structure with a well-defined resistance and support zone.
Key Levels:
📌 Resistance: Around $2,940 (previous rejection zone)
📌 Support: Around $2,900 (previous consolidation zone)
📌 Target: $3,014 (+3.16% move)
Technical Analysis:
🔹 Gold recently broke out of a bullish flag pattern after a strong uptrend.
🔹 Price successfully retested the support zone and is now pushing higher.
🔹 A breakout above $2,940 could trigger a sharp rally towards the $3,014 target.
🔹 Volume confirmation and strong momentum support further upside potential.
Trade Plan:
✅ Long above $2,940 with a target of $3,014
❌ Stop-loss below $2,900 to protect against fake breakouts
Gold remains bullish, and if the price holds above the breakout zone, we could see a strong move higher! 🚀

Bullflag on UNP! 🔉Sound on!🔉
📣Make sure to watch fullscreen!📣
Thank you as always for watching my videos. I hope that you learned something very educational! Please feel free to like, share, and comment on this post. Remember only risk what you are willing to lose. Trading is very risky but it can change your life!

ADA breaking up from bullflag/handle targets= 1.88 & 2.40Unless this is some sort of strange bull trap. The recent declaration o Trump’s Truth Social page that he will be including ADA in the Strategic reserve has resulting in a major pump for cardano here which will likely confirm the breakout of both this bull flag its currently above and the cup and handle it’s about to be above (yellow line) *not financial advice*

What's next for Bitcoin? Chop into end of March, then 165kI believe we are in the last leg of the cycle here.
I expect another sideways chop to form a bull flag pattern into end of march, then a 3 wave move up to tap 164-165k before entering a 12month + bear market.
Fear is at an all time high, alt coin traders are completely obliterated (I have been through it too, a lot of my previous attempts to call bottoms on some coins were invalidated due to a weaking broader market), however, I believe many alts now have put in bottoming structures such as POPCAT, FARTCOIN, MOG etc.

$SOL When in Doubt, ZOOM OUT! BULL FLAGHere's a better look at the RSI being the most OVERSOLD since JUNE 2023.
Obvious Bull Flag.

Bitcoin - No one is expecting this move! (must see)A lot of people are turning very bearish on Bitcoin, but I don't think it's time to be bearish, the bearish trend is not confirmed at all, and the price of Bitcoin should first touch the long-term major trendline (2017 -> 2021 -> 2025). You want to sell at the touch of the trendline. The second option is to use the Fibonacci extension tool and look for the 1.618 FIB. I did it for you, and the 1.618 FIB is exactly at 122,069 USD.
Bitcoin is currently in the final stage of the bullish cycle that started in 2022 (15,632 USDT) and is predicted to end in 2025 (around 125,000 USDT). This was a pretty good investment, but if you are jumping in right now, you will most likely get hurt in 2025 and 2026. Let's take a look at history to see what we can expect in the next few years.
Bitcoin crashed by 84% (in 2018) and 77% (in 2021). These are the classic bear market crises that Bitcoin experiences every 3–4 years. It's because we have halving events (reducing rewards for miners in BTC) every 4 years from a fundamental perspective. You may know that Bitcoin is highly volatile. History is telling us that in 2025/2026 a huge bear market and crisis are ahead.
From the Elliott wave perspective, we are in the final wave (5). We can expect an ABC correction in 2025/2026 which would bring the price down to 50,000. I bring you very strong technical data that you can use on your trading decisions.
In conclusion, I am currently optimistic about the price of Bitcoin for the next weeks and months. I think Bitcoin will hit 120k to 125k before we experience a major drop or flash crash. It's safe to buy/long Bitcoin, but do not forget to take profit!
Write a comment with your altcoin, and I will make an analysis for you in response. Also, please hit boost and follow for more ideas. Trading is not hard if you have a good coach! This is not a trade setup, as there is no stop-loss or profit target. I share my trades privately. Thank you, and I wish you successful trades!

AUDUSD bullish signs visible,- can we see higher bullish?
FX:AUDUSD we having DESCENDING CHANNEL which is breaked, a little above its visible and BULLISH FLAG pattern which is also breaked. Price currently on zone.
Yesterday we are have inauguration day, from which expect having bullish impact here.
SUP zone: 0.61900
RES zone: 0.63800, 0.64300
