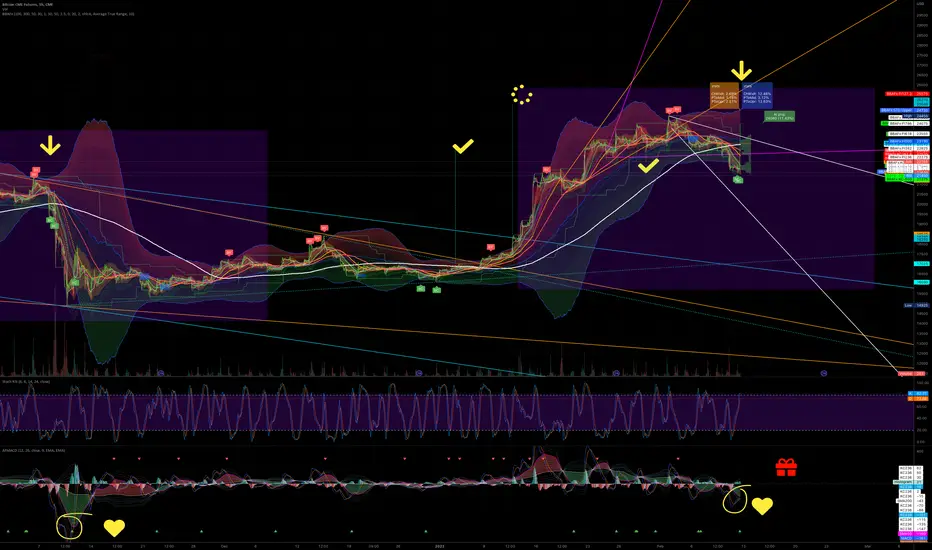
Why bitcoin is not going to hell?Well, take a look to this chart, this is the moment and this is very different from the last time that bitcoin visited the 15 K, so don't expect to see 15K again. I think will see a uptrend continuation this week, starting from today, have a nice week!
Bullish Flag
While the price is held by the Short Support Level, do not openGreetings friends, in this idea I will analyze for you the situation on the Bitcoin chart.
On the 1D timeframe, we see an excellent working out of the rare Adam and Eve pattern. At the moment, the price of the coin is held by the Support Level of $22788 and I would not advise you to open a short position. If you want to enter the position now, I would consider going long to the Resistance Level of 25149 $. If the price breaks through the Support Level and consolidates, then you can consider a short position.

USDJPY I Intraday buy from support Welcome back! Let me know your thoughts in the comments!
**USDJPY Analysis - Listen to video!
We recommend that you keep this pair on your watchlist and enter when the entry criteria of your strategy is met.
Please support this idea with a LIKE and COMMENT if you find it useful and Click "Follow" on our profile if you'd like these trade ideas delivered straight to your email in the future.
Thanks for your continued support!

Tron TRX is breaking out! Explosive pump is likely.
As you can see, TRX is currently breaking out of the descending triangle on the daily/weekly timeframe, and an explosive pump is now likely!
The take-profit is at the top of the triangle, which is 0.18 USDT. I think it's possible to go higher, but we don't want to risk anything, because we could be in wave 5 from the Elliott Wave perspective. Triangles are typically formed as a 4th corrective wave.
This bull market that started in January is absolutely amazing, and I hope it will continue as long as it possibly can! We want to take as much profit as possible from this bull run.
Sending USDT via the TRX network (TRC20) is very popular among crypto people. Furthermore, Tron's value held up very well during the 2022 bear market. It's definitely a positive sign.
Now is the best time to buy TRX if you don't want to miss out on the upcoming pump! It will be huge!
This analysis is not a trade setup; there is no stop-loss, entry point, profit target, expected duration of the trade, risk-to-reward ratio, or timing. I post trade setups privately.
If we take a look at the previous price action from 2020 to 2021, there are no gaps that need to be filled. In other words, it's possible that we will never go back to these levels.
I'm not sure how you feel about it, but I'm already long in the futures market. 171% is a good profit, so be greedy!
Thank you, and for more ideas, hit "Like" and "Follow"!

Bitcoin - Prediction of the future! +20% this month.
This is what I expect from BTC in the next few days / weeks. I think everyone is still very bearish, so it's time for a massive, mind-blowing pump!
On the chart, you can see my prediction of the price action and how it could possibly look.
Bitcoin is still pretty much consolidating in this parallel channel, and that's why we should see an explosive move very soon.
If you want, you can wait for confirmation, which is a bull break of the local flag pattern. The aggressive entry was below the FOMC candle, which is where the majority of traders' stop losses are.
Bitcoin is currently sitting in a very strong support zone, and it's hard to see a breakdown at this point. I don't want to short the support. Usually I want to long the support.
This analysis is not a trade setup; there is no stop-loss, entry point, profit target, expected duration of the trade, risk-to-reward ratio, or timing. I post trade setups privately.
The trendline from December can be your next profit target. You cannot see the start of the trendline, but it started on December 14.
Sometimes it's better to take a look at ETH, because we can see a clearer chart. The price action on ETH is much more enjoyable, and to be honest, I see a big pump soon!
Thank you, and for more ideas, hit "Like" and "Follow"!

NASDAQ 4HHey traders, in today's trading session i'm are monitoring US100 for a buying opportunity around 12199.9 zone, once I will receive any bullish confirmation the trade will be executed.

Conflicting trading ideasOn both Daily Chart and 4-Hourly chart, there is a Bullish confirmation from the Daily Chart Bullish Crab Pattern's with Wedge and RSI Divergence setup and 4-Hourly chart a potential Bullish Flag Pattern.
Personally I'm waiting for a counter-trend trading opportunity on the Bearish Shark Pattern 🦈 traded off at 97.95.
What's your trade plan for this pair?

i have found diamond pattern on chart i have mark the level in chart follow it comment me for chart analysis

Bitcoin - Secret pattern, no one talks about!
Bitcoin will definitely reach 30,000 - 32,000 USDT this month, but after that the bears will try to shutdown Bitcoin, because of a massive resistance on the daily chart, so keep reading!
Why is the 30k-32k level so strong? We have 4 confluence points here, and different people will sell Bitcoin at the different levels, but they are very close to each other, so it can end up with a significant crash.
You can see the confluence on the chart, the levels are absolutely extremely strong, and it's really hard not to see any reaction here at all.
This analysis is not a trade setup; there is no stop-loss, entry point, profit target, expected duration of the trade, risk-to-reward ratio, or timing. I post trade setups privately.
We have seen a very positive reaction to the FOMC meeting on Wednesday, which is also important from a fundamental perspective.
My plan is simple, I don't want to short Bitcoin until we reach my specified levels. It's better to ride the uptrend with longs than get rekt with shorts. I recommend you do the same.
Look at my previous idea about "25% CRASH from this level! Be prepared." in the related section down below, very important!
From the Elliott Wave perspective, we have started a whole new bull market, and I expect this bull market to end in September 2025. How much could Bitcoin reach? 160,000 USDT or 360,000 USDT? You know my price target from my previous ideas for the long term.
Thank you, and for more ideas, hit "Like" and "Follow"!

ARCB - BullflagARCB has formed a bullflag above this diagonal resistance
I have plotted a few bars pattern structures that the bullflag may take place in
Bullflags break out bullishly as indicated by the name

Cardano bullish flag TGT 0.5592Hay Trader!
This analysis is based on the idea of a Bullish Flag. The flag is visualized by the green support line and the red resistance line. Within these lines, the price has moved since the beginning of May 2022 and created this bullish formation. Using the Fibonacci instrument, a number of resistance levels can be expressed in the analysis. These resistance levels which are also potential support levels are located at 0.3926, 0.6903, and 0.8996 respectively. In addition, the instrument can also be used to determine where the target should be placed in relation to the price development of the formation (0.5592). With a good safety net in the form of support levels at 0.2395 and 0.3288, the price has some security. In addition, it can also be seen from the recent day's development that the price has recently experienced a high trading strength.
I hope this analysis was instructive and came up with some good points that can help create a picture of Cardano's current situation and how it is going to evolve in the future.

Cardano bullish flag formationHey Trader!
This analysis is based on the idea of a Bullish Flag which is illustrated in this analysis. The thick bottom line that follows the market price is the support line for Cardano. On the other side of the price is the resistance line. This flag is pointing downwards which is a strong signal that the price will break out as a bullish breakout. Since late December, when the price formed the current strong support at 0.2395, the price has begun a bullish trend where it has recently shown its potential to break this flag formation. If the price is to follow Fibonachi's indication, the price has the potential to reach the target at 6.0035
I hope this analysis was instructive and can be used for thinking about how the price trend can potentially fluctuate in the future.

$APT - Brewing again !Hello my Fellow TraderZ,
#APTOS after already a surprised move of nearly 500%, consolidating within a Bullish Flag channel on hourly TF. Soon expecting a new high for $APT again. What a insane performance.
Keep watching till the Breakout.
CHEERS!!!

The Fomo Spike BULLISHthat little SPIKE means everything Clear indicator BTC wants to move higher !
#btc

W - strong price actionW had begun to form a saucer base pattern since Sep2022 (4 months basing), eventually cumulating to a break above it's neckline last Friday ( 20 Jan23) on very large volume. The following Monday on 23 Jan23, W announced it will cut 10% of its workforce and the market reacted by gapping the stock straight above it's 200 day moving average on yet another high volume day.
Since then it had pulled back a little, forming a potential bullish flag. Will the recent gap close soon? not necessarily, if it is a breakaway gap (which usually signify the start of a new trend). Can only wait and see.
Meanwhile, it is worth a shot to go long as long as it starts to break above the bull flag, with initial stop loss placed just slightly below the start of the gap @ 46.70. Trail stop up once the trade goes our way.
Disclaimer: Just my 2 cents and not a trade advice. Kindly do your own due diligence and trade according to your own risk tolerance and don't forget that money management is important! Take care and Good Luck!

SNXUSD: Bullish ConsolidationWe have what looks to be Bullish Consolidation with Bullish Divergence leading into what could be a Bullish ABCD BAMM with a target of $3.173

EOSTRY EOS #EOSTRY $EOS update LONG You can see all patterns try to move up .
Trend goes up and accumulation is going to crazy in future time. USDT and TY currecies are on the way to up side

XRP Trading At the Demand Line of a BullflagWe might see XRP bounce back up from this Flag Bottom and the 800 EMA

BUY GBPAUD- Descending channel that was broken and retested, given us the signal of a trend chage.
- Bullish flag pattern formed as well giving us the signal for an up trend continuation.

EOSTRY EOS #EOSTRY $EOS LONG PERIOD Eos has so many patterns from the deep period. We will see so many developments soon

BULLISH FLAGa swing trade on silver, i just identified a bullish flag on a weekly timeframe on XAGUSD, I LOOK FOWARD TO A FLAG BREAKOUT AND A POSSIBLE RETEST AND BOOOOOOOM, it has taken out the order block that started the move.
Watch out for news on USD

ambuja cement was on breakout or breakdown was happen be ready bullishflag pattern on chart and i have mark level on chart support and rasisdance

