LMT: Firing all the way up?Lockheed Martin Corporation
Shortterm - We look to Buy at 423.15 (stop at 403.98)
Price action looks to be forming a bullish flag/pennant. This is positive for sentiment and the uptrend has potential to return. There is scope for mild selling at the open but losses should be limited. Further upside is expected although we prefer to buy into dips close to the 423.00 level. The bias is to break to the upside.
Our profit targets will be 479.96 and 500.00
Resistance: 445.00 / 480.00 / 550.00
Support: 408.00 / 370..00 / 260.00
Please be advised that the information presented on TradingView is provided to Vantage (‘Vantage Global Limited’, ‘we’) by a third-party provider (‘Signal Centre ’). Please be reminded that you are solely responsible for the trading decisions on your account. There is a very high degree of risk involved in trading. Any information and/or content is intended entirely for research, educational and informational purposes only and does not constitute investment or consultation advice or investment strategy. The information is not tailored to the investment needs of any specific person and therefore does not involve a consideration of any of the investment objectives, financial situation or needs of any viewer that may receive it. Kindly also note that past performance is not a reliable indicator of future results. Actual results may differ materially from those anticipated in forward-looking or past performance statements. We assume no liability as to the accuracy or completeness of any of the information and/or content provided herein and the Company cannot be held responsible for any omission, mistake nor for any loss or damage including without limitation to any loss of profit which may arise from reliance on any information supplied by Signal Centre.
Bullish Flag

$COMP $COMPBTC #COMPBTC #COMPUSDT Bull Flag in Progress Here?I'm eyeing both the BTC & USDT pairing of COMP (Compound), which, although a little different, seem to be telling a similar story. COMPBTC in particular has my attention because the price has finally made it's way over the 200 MA on the day chart, which is huge. All the MA's are curling up nicely under the price, and it's making me think we've got just a few more days of consolidation (within a bull flag) before making a move up, possibly coming back and touching it, and then moving up higher.
I think the USDT pairing will likely take off when the BTC pairing does, and probably spend the next few days consolidating as well, as the 100 day MA is crossing nicely upward with some other smaller time frame MA's on that chart.
My target is appx 240, which represent some major price levels that can be seen on the month charts.

Dollar index DXY - Everything collapses because of this!
Except for DXY, everything is falling apart because everyone is selling their assets and buying dollars instead as a safe haven! Traders usually also need USD to open short positions on futures and speculate on price decreases.
The dollar index is incredibly strong and this trend should continue for another few years. According to my analysis and to this chart, 2025 seems like a reasonable year for a trend reversal of this ticker.
Keep in mind that this is the monthly chart for DXY and the price is printing a massive parallel channel on the linear scale and also on the log scale as well.
As per my Elliott Wave analysis, we are currently in the strongest third wave and I expect to touch the upper trendline of the parallel channel before we can experience a corrective fourth wave. After that, the 5th wave will come into play, and we can definitely throw over the parallel channel and find resistance at the previous swing high from 2001.
The DXY is a great indicator for traders and everyone should keep an eye on it. Interest rates are going up, and this is a negative indicator for the stock market.
Look at my ideas about Gold and Bitcoin in the related section down below.
For more analysis, hit "Like" and "Follow"!

$PYPL Paypal. Holding up well in volatile marketsPaypal held up well during some very volatile days. Looks like it's building a nice looking bull flag.
Sitting on the sideline and watching this one. A bull flag break will open a $122,77 target.

US Stock In Play: $RUN$RUN - Technology | Solar
broke out of a descending wedge during its most recent earnings report (QoQ growth in EPS and Sales) on high volume.
the past days of resilience in its price action tells alot of its strength in this market. already at RS high before price

USDCHF in a Bull Flag formation.USDCHF - Intraday - We look to Buy a break of 0.9635 (stop at 0.9609)
Price action is forming a bullish flag which has a bias to break to the upside.
Short term momentum is bullish.
The bias is to break to the upside.
A break of yesterdays high would confirm bullish momentum.
Our profit targets will be 0.9696 and 0.9706
Resistance: 0.9630 / 0.9650 / 0.9670
Support: 0.9600 / 0.9580 / 0.9560

GBPJPY - Potential Bull Flag Bull Flag, is definitely 1 of my favourite. I'm excited in seeing this Flag Pattern 🚩 formation of the 1st pair I trader 17years ago.
God! I feel old.
Will things aside, I will wait for candlestick pattern confirmation before engaging this beauty.

US Stock In Play: $FOUR$FOUR - Tech | Software - Infrastructure
after a stellar earnings report on 4/8, it is coming off a base that is supported from all time low ($30) to rising 10/20 MAs.
latest close have reclaim its 200MA with a HTF setup. $50 clean pivot for BO

MDKA Potential Bullish FlagMDKA . Daily TF. It has potentially bullish flag pattern IF it brokeout the trendline (diagonal yellow line). AB=CD. TP 5300. SL 3910. R:R = 1:2.

US Stock In Play: $ARHS$ARHS - Consumer Cyc | Home Improvement
currently flagging for a follow through from its breakout (+23.91%) post ER on 11/8. sitting on VWAP from IPO, rising 10/20 MA with RS.
pivot at $9.50 will clear 6 months high

$SOND extremely bullish setup. PT's are labelled based on chart patterns.
- MMU (measured move up/ ABC)
- Bull flag breakout imminent and the PT breaks the neckline of the inverse head and shoulders.
- A break of the neckline of the inverse H&S gives us the PT based on Thomas Bulkowski's statistical work.
It is also important to note that the MACD crossed to the upside on the daily and the RSI is still not oversold. No bearish divergences in the momentum indicators. THIS IS EXTREMELY BULLISH.

Stellar XLM - Huge dump is incoming! Falling wedge + triangle
On the daily/3D chart, we have a pretty strong bearish downtrend. We just hit a brand new low a few days ago, so it's really not looking good at all.
We can spot a triple bottom, which is usually a sign of a descending triangle pattern or a rectangle continuation pattern. There is a lot of liquidity below this level and the market usually comes for the stop losses.
The chart is printing a falling wedge and a local descending triangle. Both of them have a bearish bias until we break these patterns.
We deeply need to go down for the final fifth impulse wave to complete this ABC correction. Because otherwise, if we pump now, then this structure was an impulse and it's going to be a dead cat bounce rally, followed by another bear market below 0.026 USDT.
XLM is a great coin and I believe we will have a massive pump in 2023-2024, but for now it's still bearish and we need more confirmation to buy this altcoin.
For more analysis, hit "Like" and "Follow"!

bullish flag can make another leg up for ETC#ETC/USDT
$ETC had more than 140% increase since my analysis from 6/12/2022 and broke out from descending trend line.
🐮 now price shaped a bullish flag pattern and we just need a confirmation of the weekly candle to close above the channel.
so if we have this confirmation price can increase toward 1.618 fib level of last swing high (which is between upper trend lines) to complete flag Pattern and also it can be AB=CD pattern that can be complete.

ETH/USDT : S/R zones are important! BINANCE:ETHUSDTPERP BINANCE:ETHUSDT
Hello everyone 😃
Before we start to discuss, I'll be so glad if you share your opinion on this post's comment section and hit the like button if you enjoyed it!
$ETH has formed, Also it has broken above the resistance zone ($1680 - $1700) Which has become an S/R zone now.
The momentum is locally bullish, But $ETH has lost it'ss strength and besides that, $BTC's Dominance is increasing!
However, the Bullish flag is a bullish pattern as it's clear just like what it's called.
So, If we get the break above the flag, Then We might see another to the $1818's S/R line.
But, there can be also a bear trap below the flag to the lower S/R zone to gather more liquidity to hunt!
If $ETH loses the support at $1680, Then the deviation below $1640 is likely to happen and in any case of pullback, We'll take Long towards $1760 and $1818 again.
The deviation scenario will be valid till $ETH breaks below the lower S/R zone ($1555 - $1570), In that case; I'll start to trade in range bounds again.
Hope you enjoyed the content I created, You can support us with your likes and comments!
Attention: this isn't financial advice we are just trying to help people with their vision.
Have a good day!
@Helical_Trades

✅Bitcoin - You haven't seen this before! New triangle + wedge
Everyone is extremely bullish right now and is saying the bottom is in. But I am still very sceptical. We are having a relief uptrend as predicted in my last analysis.
The downtrend is really strong and there is absolutely no sign of a trend reversal at this moment!
As you can see on the weekly chart, we have an incomplete falling wedge pattern and clearly there is still a lot of price action missing.
It looks like we are creating a trading range on the daily chart. Something like a symmetrical or descending triangle.
Regarding my Elliott Wave analysis, I think we can create some kind of triangular formation before continuing lower.
The question is, how much lower can we go? We have a gap at 12 500 USDT, which is a reasonable target and the one and only one support on this particular chart. We can use a fibonacci extension from wave 3 to wave 4, but it's still too early because we don't know if wave 4 was completed or not.
If the trading range is confirmed, then altcoins can moon during this phase and Bitcoin's dominance should continue in the downtrend.
For more analysis, hit "Like" and "Follow"!

LUNA Classic next entry level! Here's a quick Look at LUNC 30 min chart.
The best entry would be when the price breaks above 0.000451$ with a good amount of volume.
-------------------------------------------
The idea is: Buy when the price breaks above 0.000451$ and take profits at the levels shown in the chart.
Targets:
1. 0.000465$
2. 0.00048$
3. 0.0005$
4. 0.00052$
-------------------------------------------
What are triangles when it comes to trading?
Key points:
"1. In technical analysis , a triangle is a continuation pattern on a chart that forms a triangle-like shape.
2. Triangles are similar to wedges and pennants and can be either a continuation pattern if validated or a powerful reversal pattern, in the event of failure.
3. three potential triangle variations can develop as price action carves out a holding pattern, namely ascending, descending, and symmetrical triangles."
-------------------------------------------
If you like the content, then make sure to comment and like the post :D
Follow me for daily profitable trading setups
BTC dictates the market. If BTC falls, then Alts will fall as well. Trade safe!

POLKADOT PERSONAL ANALYSIS IN THE SHORT TERM (RE-SHORT RETEST!)The total evaluation for the POLKADOT asset is completely bearish. Please be warned of your risks and make sure to manage it properly. I see the same confirmation candles as well in the daily for a potential reversal to the upside, take your profits always and remember to short at great levels of volume congestion for a bigger edge. A retest on the support we failed to hold will most likely be a proper target with a potential to make mega dumps even further.
-------
Thank you for reading! Remind you that this is a 1H chart since the movement is more clean rather than 4H chart and 1D chart which are mostly jumbles. The 1H chart even explained how we broke through an important resistance from the bottom forming a bullish flag. Like this chart? Share it, bookmark it, save it -- its yours, for free!

LUNC about to go higher!Here's a quick Look at LUNC 1 hr chart. As we can see, the price has been forming a bull pennant and a break to the upside could be around the corner. If BTC goes south, then this setup won't be relevant.
The best entry would be when the price breaks above 0.0000255$ with a good amount of volume. One to keep an eye on.
-------------------------------------------
The idea is: Buy when the price breaks above 0.0000255$ and take profits at the levels shown in the chart.
Targets:
1. 0.0000265$
2. 0.000028$
3. 0.00003$
-------------------------------------------
What are triangles when it comes to trading?
Key points:
"1. In technical analysis, a triangle is a continuation pattern on a chart that forms a triangle-like shape.
2. Triangles are similar to wedges and pennants and can be either a continuation pattern if validated or a powerful reversal pattern, in the event of failure.
3. three potential triangle variations can develop as price action carves out a holding pattern, namely ascending, descending, and symmetrical triangles."
-------------------------------------------
If you like the content, then make sure to comment and like the post :D
Follow me for daily profitable trading setups
BTC dictates the market. If BTC falls, then Alts will fall as well. Trade safe!

S&P 500 - A new all-time high this year! | Elliott Wave + Wedge
SPX500, together with Nasdaq, has incredible power and is a great opportunity for traders and investors.
On the 4h/daily chart, we have a descending broadening wedge, so you can wait for a breakout of this pattern to enter a long position.
According to my Elliott Wave analysis, an ABC correction has ended, and there is a strong possibility of a new impulsive wave to the upside!
As you can see, we have a total of 3 trendlines on this chart, which prints a very nice market structure.
The previous all-time high is the next stop, and after that, we will go much higher.
The price is currently sitting on the 0.618 FIB, which is definitely the strongest fibonacci level that provides a tremendous buying opportunity at this point.
Look at my ideas about Bitcoin, Ethereum, and TOTAL crypto market cap in the related section down below.
For more analysis, please hit "Like" and "Follow"!

TOTAL Crypto - Key support defended! Above 200MA + 0.382 FIB
The charts never lie and, as you can see, the bulls successfully defended the 200 weekly moving average and previous swing high from 2018. We didn't even close a candle below the 200MA!
We need to keep in mind that the 200 weekly MA is the strongest MA of all of them, and this zone is considered a strong support by huge institutions and hedge funds.
If we drop below the 200MA for the first time, then you can bet on a 10-year bear market and sideways boring price action. You don't want this to happen, even if you are a bear. Yes, you want to buy cheap bitcoin at 13 000 - 6 000, sounds good, but you will wait 10 years for another bull market cycle.
But for now, everything is perfect and we also hit the 0.382 FIB retracement from the previous impulse wave on the LOG scale. 0.382 is the second most important FIB level after 0.618. If you calculate it: 382+618 = 1.
If we take a look at the MACD indicator, we can spot a bullish divergence on the histogram and also a bullish tick. So this tells us the bears are running out of steam and the bulls are gaining strength again.
A lot of traders are very bearish. Altcoins like ADA, LINK, SOLANA, XRP, etc. will perform poorly in the next bull market in my opinion. These altcoins are great, but they need more time.
I expect tremendous gains for selected altcoins. You can find them in the related section down below.
For more analysis, please hit "Like" and "Follow"!

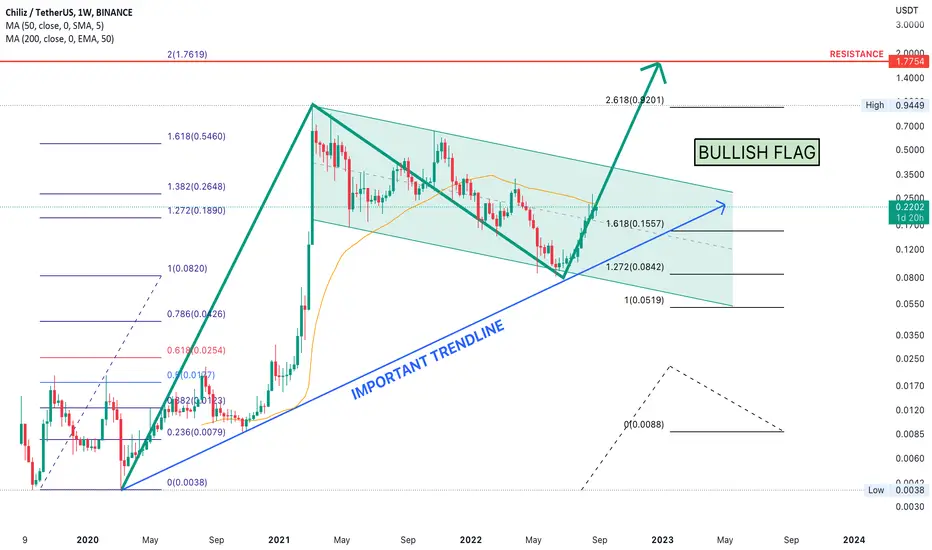
Golden Cross and Bullish Flag, $1.7 On weekly chart,
BINANCE:CHZUSDT has some signals for next bullish to 1.7
#1 - Completed the correction wave at 0.81
#2 - Bullish Flag touched lower channel and bounce back.
#3 - Touched and bounced from Important Trend Line
I figure out target of 5th wave at 1.7 with golden ratio 2.0 Fib from 0.81 which is the 4th wave.
Let's wait and see.
Bitcoin BTC - Ready for a massive uptrend! | Elliott wave
Bitcoin has successfully completed a retracement of the first impulsive wave! This correction was very fast but also relatively strong (almost 0.618 FIB). This was a classic retracement for the second wave.
It is possible that we see these lower prices for the last time, so if you are still hesitating and waiting for 13 000 USDT or even 6 000 USDT per bitcoin, then I think it's not going to happen. It's everyone's dream to buy cheap Bitcoin.
We must remember that Bitcoin successfully defended its previous all-time high from 2017, which was around 19 000 USDT, depending on exchanges.
The third wave of the first impulsive wave is an extended diagonal, which is pretty rare to see in the market. But as per Elliott Wave himself, diagonals also appear in third waves.
The next major resistance and high liquidity area is exactly at 34000 USDT. It's very likely that we will make a pullback here.
Bitcoin is pretty weak compared to altcoins like BNB or ETH, because the BTC.D (Dominance) chart is going down and people prefer altcoins instead of Bitcoin at this moment. This trend should continue for another year (alt season).
For more analysis, please hit "Like" and "Follow"!

US Dollar forms a bullish flag against Swiss FrancAfter having made research and taking in to account the current conditions i think that sadly we can see a strong pump in the us dollar for the coming weeks.
If you look at the chart of Swiss Franc against US Dollar you can clearly see a bullish flag pattern which usually indicates an accumulation followed by a continuation on the actual uptrend.
If the price opens and closes over the upper trend line i will consider to open a long with targets 1.021 1.07 1.15 and 1.25 and i will set an stop loss order at 0.957.
In the case that a clean daily candle is printed over the upper trend line i will try to enter at the pullback of the breakout with a limit order on 0.974.
If the price fails to close over the upper trend line this setup is invalidated.
I would be glad to see what do you think in the comments and if you agree with me don't forget to give a boost.
Regards and happy trading.
