$AMD failing bull flag, 0.5 fib retracementFailing bull flag on AMD, not retesting 0.5fib level and around 50SMA. Potential to get down to $83-84. Looks weak
Bullish Flag

Bottom will be in December most likely: rising wedge on invertedSeptember: 15-16k per BTC, run up to 19.5K by October, resistance
October end: dump to 14.8k per BTC run to 16.7k by December
December: bottom - 12-13k
This coincides with 2018, the bottom was also in December.
The moment you see a double retest and a bullish divergence shows we are in bottom. But RSI keeps going to the high and the price is much lower, which is extremely bearish

TRADE ALERT - EOS SCALP TO $1.85Entry = 1.759
Stop Loss = 1.70
Final Target = 1.85
Risk/Reward = 2/1
Leverage = 1x
Profit Potential = +5%

BNB swing short opportunityBNB Broke the support of $309 on 17 August 2022, the day after we confirmed that breakdown and brought BNB to the construction support at $276. Now BNB is climbing up.
At $313, the 0.618 resistance is coming in, so an nice opportunity to short is all the way down to at least $277 again. as you can see BNB is breaking out his Bullish flag pattern on the shorter timeframes, The bullish target of this pattern is also around the golden pocket (0.618), so an extra comfirmation to short it.
more comfirmations are another Lower high on the 2/4 hourly and the rejection point (supply) at $320.

AS Rome Fan Token ASR - Huge opportunity! Head and Shoulders!
For some reason, fan tokens have been very strong in recent weeks, so it's a good time to buy!
We have an inverse head and shoulders and a falling wedge pattern on the daily and weekly charts, which is great to see.
Also, the main trendline from 2020 has been destroyed by the bulls recently, which is another great sign of upcoming strength.
If we take a look at the volume indicator, we can clearly see massive bullish volume this year, so there is definitely an increase in interest.
The profit target is at the all-time high resistance level. You can also focus slightly below this level.
I expect tremendous gains for selected altcoins. You can find them in the related section down below.
For more ideas, please hit "Like" and "Follow"!

BULL FLAG! TARGET 15K FOR BTCUSDTInvert the chart and you will see a bull flag, with target of 14900 USDT!

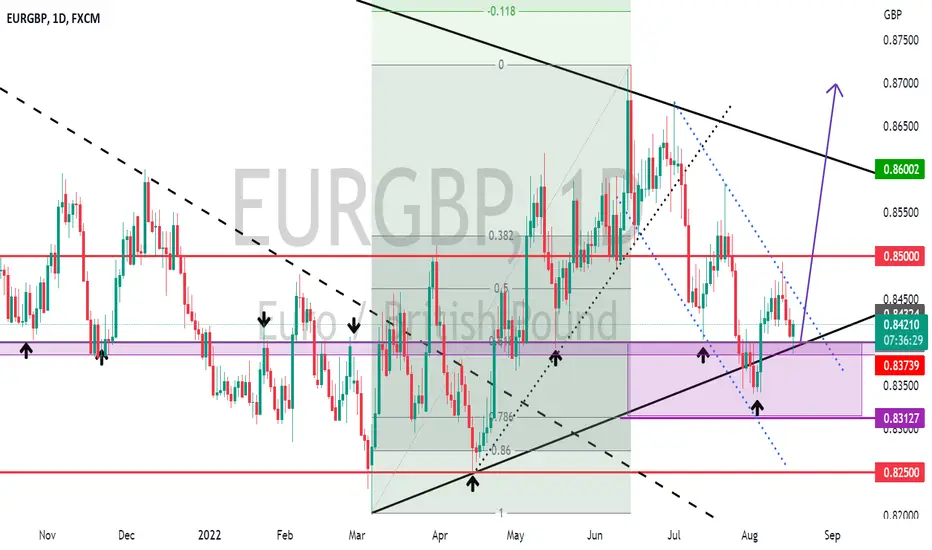
EURGBP POTENTIAL BULLISH FLAGWeekly TimeFrame shows a retracement of 61.8. On D1 we have a potential Bullish Flag. Looking to Confirm our entry after close of D1 candle today.
Ethereum ETH - More upside is coming! | Elliott Wave | Channel
People are calling for ETH to flip BTC, but this is really a serious thing. If BTC loses its #1 position, then it could be a catastrophic scenario and may cause a panic sell of BTC. Of course, this event will take down all coins.
But I don't really see any reason for ETH to flip BTC. If you want to bet on it, then good luck, but the chances are really low in my opinion.
But overall, Ethereum is still one of the strongest altcoins in the crypto market at this moment.
I expect one more impulsive wave to the upside to complete the superior impulsive wave (as per my Elliott Wave count).
Also on the daily chart, we have an ascending parallel channel with a very well respected upper trendline.
There is absolutely no bearish divergence on the RSI indicator, so the uptrend is really strong and stable. Of course, there is a possibility that we will retest the parallellity of the channel from the downside.
Look at my ideas about Bitcoin, alt season and BTC dominance in the related section down below.
For more ideas, please hit "Like" and "Follow"!

Bitcoin BTC - Explosive breakout soon! | Wedge | Elliott Wave
Bitcoin is still struggling to do an impulse wave with a gap. The rising wedge is close to a breakout, but be aware of a possible fakeout first.
On the daily/4h chart, we have a total of 9 waves, which is really great at this point, because this indicates a motive/impulsive structure.
Generally, 5,9,13,17,21 are motive/impulsive structures. On the other hand, 3, 7, 11, 15, 19 = corrective structures. Please keep that in mind!
So if we drop even lower from this point, to 20k, for example, then we can count this 9-wave structure as an impulsive wave and we can expect much more later.
As per my Elliott Wave analysis, the next wave to the upside should be a massive impulse wave that all bulls want to see.
The rising wedge also looks a little bit like an ascending triangle, which is, of course, a very bullish pattern.
Next stop 32,500 USDT. We can also wipe out all stop losses at this level before a possible consolidation.
I expect tremendous gains for selected altcoins. You can find them in the related section down below.
For more ideas, please hit "Like" and "Follow"!

#4 Bull FlagNext in the series of Bull Patterns is the Bull Flag.
The bull flag is usually the result of a strong up trend followed by consolidation of price that can lead to a continuation of the bullish up trend.
The three main traits of a bull flag are:
A) Pole - Rise in Price
B) Flag - Consolidation Channel
C) Breakout - Measured by Flag Pole, Confirmed with Volume
Further confirmation should be used to confirm the breakout.
A) look for a retest within a few sessions.
B) volume to confirm breakout.
Other confirmations a breakout is imminent could be:
1. Breakout level returning to past levels.
2. TSLA Stock split are extremely bullish (august 24).
3. Wider Market Trend is shifting bullish.
4. Elon indicating inflation is cooling.
For more in my bull pattern series, checkout #1 Double Bottom

Rose : A longing opportunityRose broke out of a resistance zone and is currently consolidating inside a bull flag in the 4H Timeframe. A breakout from here will be a long signal for me and target will be below the weekly resistance level.

ETHBTC days away from 1day chart goldencross.Here we see the monthly logarithmic chart for the ethbtc pair so the impending golden cross is not shown here. It is only a few days at most away from crossing and we can see here on the log chart that the ethbtc chart’s priceaction is well above an inv h&s pattern and likely has validated the breakout of this pattern even though we haven’t reached its full measured move target just yet. We can also see how price action is now poking a monthly candle above this monthly bullflag in white here. I think it is very possible for ethbtc to continue pumping past the 1day golden cross on its way to hitting both of these chart pattern’s (bullflag and invh&s) targets. However there is such huge anticipation for Ethereum switching over to proof of stake that there is a high probability since the date for it has been announced so far in the future, that it will be a buy the rumor sell the news type of event that pumps up until the event then dumps the week or day of. The one possibility that could keep this from being a sell the news event however is If enough people post predictions that it will be a sell the news event…in which case if everyone in the herd is expecting a sell the news dump it could even continue to pump day of. For now though, it seems the overall sentiment believes the switch will lead to a pump so sell the news has a higher probability at the moment. That could change the closer we get if more and more analysts and youtube personalities start warning of a sell the news event. Quite the paradox really lol. In the short term however I think continued upside after the golden cross is likely, but if we dump on the day it switched to proof of stake the golden cross can still easily be a fake out that flips back into a death cross soon after, so it’s wise to stay vigilant. *not financial advice*

ETC to $90 and even MOON#ETC/USDT
#update
$ETC did the pullback to the broken weekly zone and broke out the bullish flag pattern.
🐮 so it will continue its fly to the moon 😎

Double bottom & bullflag both share the same breakout targetWe can see the double bottom pattern here in blue and the bullflag in lime neon green. Both breakout targets take us to the 26.3k range. This is great bullish confluence also great to see how when inside the flag the price action held perfect support when retesting the teal horizontal neckline of the double bottom. This all appears to be leading to something potentially much much bigger though as we can see on the coinbase chart price action is now above this descending white trendline. If we can flip this trendline to solidified support we might see a much bigger macro chart pattern breakout of a monthly chart falling wedge that has a much bigger target. I will post a separate Idea about that pattern and link both of these ideas together. Looking quite bullish overall I think the uptrend is going to be officially confirmed here. *not financial advice*

EURUSD CPI Report Breakout-What's Next!Welcome back! Let me know your thoughts in the comments!
**EURUSD - Listen to video!
We recommend that you keep this pair on your watchlist and enter when the entry criteria of your strategy is met.
Please support this idea with a LIKE and COMMENT if you find it useful and Click "Follow" on our profile if you'd like these trade ideas delivered straight to your email in the future.
Thanks for your continued support!
Brian & Kenya Horton, BK Forex Academy

NZDUSD BUYDouble top rejection
price with an impulsive move up and LTF correction
NZDUSD BUY
Entry: 0.62885
SL: 0.62650
TP: 0.63824
RRR: 1:4.00

Bitcoin Bull Flag Setup In The 4-hour ChartLooking at Trading a possible Bull flag pattern on Bitcoin (BTC/USD) today.
In the Daily time frame, we are still in that large ascending channel and we have had a nice bounce off of the bottom of the channel suggesting a move higher.
In the 4-hour chart, there is a bull flag forming. We have an impulsive move up with four bullish candles taking out previous resistance. Accompanying this impulsive move upwards is large bullish volume. These are the two things we want to see when looking for a flag pole.
We then see the price cooling off and taking a breather while it slowly moves downwards which creates the look of the actual flag itself. We have three taps at the top of the flag and four at the bottom. We can see that the price is bouncing off of these two points of support and resistance. Accompanying this cool-off, consolidating period is low volume, which suggests that the price is just taking a breather and the bulls are getting ready for another leg up.
What I would want to see to confirm an entry for this bull flag is the following.
I have highlighted a yellow zone at the top of the flag pole. I want to see price impulsively break this yellow zone and close above it. I also want to see large bullish volume to accompany this impulsive move up. Then, If we see that, I want to see the price retrace back into the flag pole zone before opening up a long position targeting the middle of the daily channel. The price point around this target would be the 25500 level.
This risk to reward (depending on where you place your stop loss) could be a nice 1 / 3 or 1 / 4.
The price always respects the middle of a channel. This is why my target is the middle of the daily channel.
But for me to enter a long position in (BTC/USD), I need all those entry requirements to be met.
So let us see if we get that impulsive break, large volume, and a retrace. If we do, the vortex trader is going long on Bitcoin.
As most of you know, I am a crypto investor. This means I'm a crypto bull. But with regards to trading, I only trade the setups that the charts provide. One cannot jump into a position blindly without having a set of rules and reasons for entering and exiting. If you do this, it’s the same as gambling. But if you follow your rules and only enter positions systematically, then you are following a system that has been proven to be profitable and consistent and in the long run, according to your backtesting, this will yield you positive results.
On that note, I bid you all a great day.
Let's go Bitcoin!
The Vortex Trader.

TOTAL Crypto market cap - New rising wedge on the weekly chart!
2023 is going to be a very bullish year for crypto in my opinion!
I believe we can reach a market cap of 6-7 trillion dollars by December 2023.
Most likely, you have never seen this rising wedge elsewhere, because it's a brand new pattern on the weekly scale (LOG).
200 moving average is considered a strong support by huge institutions and hedge funds, and the bulls successfully defended this area.
As per my Elliott Wave analysis, the ABC correction has been completed on the macro scale, and now we are ready for another bull market.
We have a tremendous confluence to buy cryptocurrencies at this moment, as you can see on the chart.
I expect massive gains for selected altcoins. You can find them in the related section down below.
For more ideas, please hit "Like" and "Follow"!

BTC IDEA FOR TODAY 06.08.2022BTC breakout from bullishflag on 1h time frame and made falling wedge on 15m chart, looking for another leg up, but also we need to remember that today is weekend soo volatility can be pretty high, tight stop loses will be good.


70% UP IN 2 MONTHS: AMAZING STRATEGYHELLO FRIENDS!
Analyzed this stock 2 months back in my videos in my channel. Worked perfectly as per the analysis. Target is 300% which I assume may hit in 2 months.
Logic behind this trade is Stock was facing resistance of the trendline for a long time. In the third attempt in June it broke the trendline. Another logic is the stock had given breakout above the 50ma band and sustained above that for so long, which indicates bullishness of the stock and the entry of BIG BOYS.
One can notice the increasing volume bars too, which is proving the bullishness.
Entry was confirmed by the trendline breakout.
Captured 77% till today and we'll wit for the target with railing stoploss.
All levels are provided in the chart which explains everything.
I hope you all understand the logic behind the trade and will learn it.

NQ to 14k?possible ABC or Bull Flag spotted, for fun only. NOT TRADING ADVICE!!!!!
Following this idea with real money can make all your money vanish!!!!

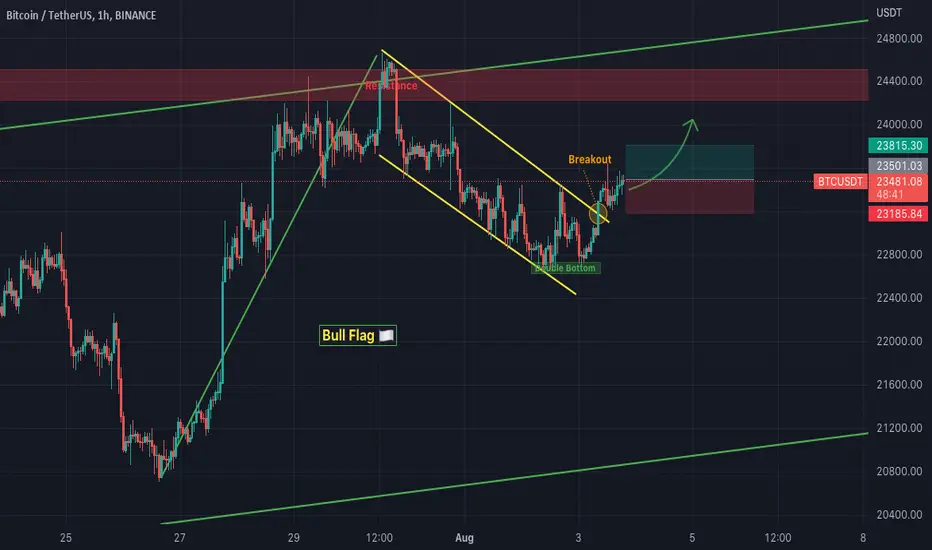
BTC/USDT - 1H - Bull FlagBTC/USDT is in a bullish trend . The price action recently broke out of a Bull Flag chart pattern during a pullback. Expecting bulls to push prices higher towards resistance .