AutoFarm AUTOUSDT - Record Volume + HUGE Channel + Elliott Wave- On the daily chart we can clearly spot a descending channel , which is very close to a bullish breakout!
- If you take a look at volume , we have a massive bullish volume spikes - always good to see.
- 200 weekly MA is actually acting as a resistance, but if the channel breaks up, then the MA will too!
- Due to my Elliott Wave analysis - 12345 Impulse wave should be completed and now are expecting at least a retracement to 0.618 FIB.
- Look at my ideas about another great altcoins in the related section down below ↓
- For more content, please hit "Like" & "Follow"!
Bullish Flag


EU/US take buy position 1.041Hello traders
Good opportunity take buy position 1.041
go up 1.049 happy trading time
thanks

Bullish flag ahead- who´s with me?After a long period of consolidation and considering the fundamentals. I think the bulilsh flag is taking full shape and about to explode.

EUR/AUD SetupsHi traders ,This is my vision for this pair if it useful for you don't miss to support me with like and follow ♥️

MATICUSDT Bull FlagHey traders, in today's trading session we are monitoring MATIC for a buying opportunity around 0.63 zone, once we will receive any bullish confirmation the trade will be executed.
Trade safe, Joe.

Ethereum ETHUSDT - Millennium Elliott Wave + 200 weekly MA!- As per my Elliott Wave analysis on the weekly scale, we have 2 impuls waves successfully completed and now we are missing the final impulse wave!
- ABC correction (Wave 4) can be done, because wave 4 should not overlap the first wave.
- 200 weekly moving average is currently acting as a very strong support!
- Also the price is currently sitting on 0.786 fibonacci retracement.
- If you take a look at RSI indicator, you can spot a bearish divergence from previous waves, which helps us to identify the Elliott wave structure.
- Looks like the bear market can be over and we are ready for another massive bull market!
- Check my related analysis for Bitcoin down below!

INDUSTOWER LONGIndus tower forcefully trying to break long term resistance.
As per my setup expecting breakout and boom
Concentrate and trade with proper riskmanagement.
All levels marked for educational purpose

GBP/USD Long Hi Traders, pair within a bullish flag if a price broke a falling trend line and close above 1.23100 i expect rise to 1.24400
if you like the idea, do not forget to support with a like and follow❤️

GBP/NZD Long wait to broke the resistance and stability above it with 4h candle at 1.9500 to confirmation

USD/CHF 1H MOMENTUM JUNE, 20 2022In my analysis on June, 20 2022. 1H USD/CHF create bullish flag and it will break the structure of the flag, the price will go up as shown on the images. Now i standby for entry.

Walk to 1 Million - A possible ScenarioIf the 2015 pattern is playing out again, this is what it would look like. We could be close to the end of this correction.

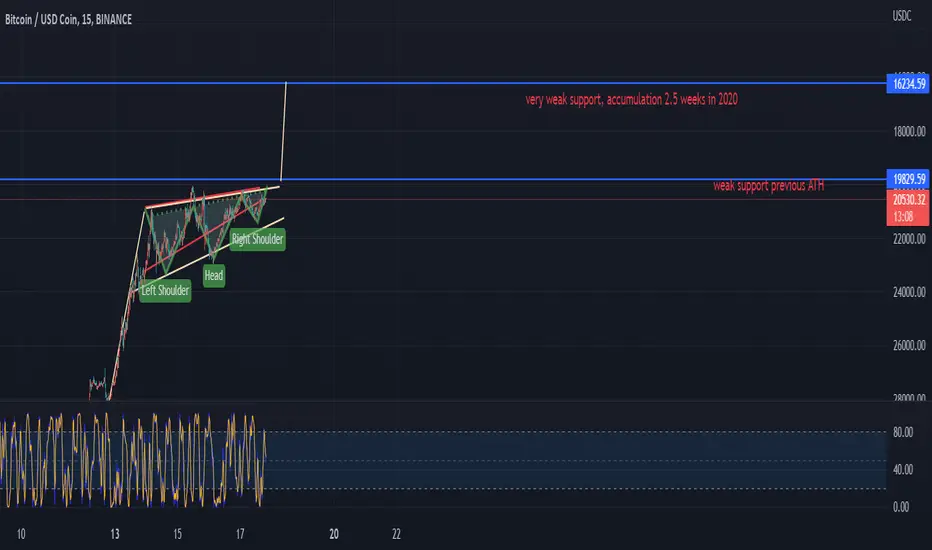
For those with doubts, zoom out (Bull Flag in progress)I think 14k is the intended target of this current correction. That would test the breakout of a major former resistance area. This would also conclude the 80% cycle correction. Not financial advise, but anything around 14 - 22K and you're getting BTC for a steal.

BTC inverted chart bull flag, next target 16.5kinvert charts and you will see a bull flag , we going to dump
Steve's Gun2Head - Buying WTI Crude OIlTrade Idea: Buying WTI Crude Oil
Reasoning: Bullish hammer formed on daily with price pushing back above 21-day sma. 4-hour bullish outside candle also helping with the short-term technical picture. Potential bullish flag on 1-hour chart.
Entry Level: 115.09
Take Profit Level: 120.61
Stop Loss: 113.49
Risk/Reward: 3.45:1
Disclaimer – Signal Centre. Please be reminded – you alone are responsible for your trading – both gains and losses. There is a very high degree of risk involved in trading. The technical analysis, like all indicators, strategies, columns, articles and other features accessible on/though this site is for informational purposes only and should not be construed as investment advice by you. Your use of the technical analysis, as would also your use of all mentioned indicators, strategies, columns, articles and all other features, is entirely at your own risk and it is your sole responsibility to evaluate the accuracy, completeness and usefulness (including suitability) of the information. You should assess the risk of any trade with your financial adviser and make your own independent decision(s) regarding any tradable products which may be the subject matter of the technical analysis or any of the said indicators, strategies, columns, articles and all other features.

Joe Gun2Head Trade - Speculative EURUSD longTrade Idea: Speculative EURUSD long
Reasoning: Potential double bottom on the Daily Chart/Bull Flag on the 60min?
Entry Level: 1.0511
Take Profit Level: 1.0735
Stop Loss: 1.0490
Risk/Reward: 8.85:1
Disclaimer – Signal Centre . Please be reminded – you alone are responsible for your trading – both gains and losses. There is a very high degree of risk involved in trading. The technical analysis , like all indicators, strategies, columns, articles and other features accessible on/though this site is for informational purposes only and should not be construed as investment advice by you. Your use of the technical analysis , as would also your use of all mentioned indicators, strategies, columns, articles and all other features, is entirely at your own risk and it is your sole responsibility to evaluate the accuracy, completeness and usefulness (including suitability) of the information. You should assess the risk of any trade with your financial adviser and make your own independent decision(s) regarding any tradable products which may be the subject matter of the technical analysis or any of the said indicators, strategies, columns, articles and all other features.

OGN - OGNBTC Bullflag (LONG)Observe the 2D chart above.
Breakout from the bullflag, with extension marked on the chart.
Also a Bollinger Band squeeze can be observed on the 2D USDT pair.
TImeframe: No idea
Return: 1x-1.3x
Leverage: 2-3x

AUDNZD Bull FlagHey traders, in today's trading session we are monitoring AUDNZD for a buying opportunity around 1.109 zone, once we will receive any bullish confirmation the trade will be executed.
Trade safe, Joe.

S&P500 3-3-3-3-3 CONTRACTING TRIANGLE CORRECTION (1HR)Looks like the flag on the 30min-1hr timeframe is developing as a 3-3-3-3-3 Contracting Triangle for upside. I believe we are starting the 3rd leg of Wave 4, which should take us up to around $4180 hopefully by tomorrow, followed by Wave 5 to around $4100 thereafter. We should see the larger time frame upside move towards ATH to resume after completion of this correction, perhaps starting next week.

Quo vadis Bitcoin?This is what Bitcoin COULD do now. The channel over the weekly timeframe is on the bottom side well supported. So lower prices should only occur by touching the bottom line in the following weeks.

USDJPY-Weekly Market Analysis-Jun22,Wk3I've mentioned for the longest time that the USD will keep appreciating, just look at USDJPY. There might be a chance of a retracement happening this Thursday, 2am(GMT+8) when the US bank interest rate is released, and if the movement break and close below the blue box(buy zone), we might have to reanalyse the market movement. For now, I'm waiting for a buying opportunity at 133.63 to capture the trend trading move by using a bullish flag pattern.

Etherium forming bull flagOn the daily chart we see a bullish flag and oversold RSI. I am opening a long for at least 20% profit :) lets go

CTVA bull flaggingCTVA had a nice uptrend recently but has had a healthy pull back to the 78.6 fib, which it has held and now looks like it's flagging. In this choppy market, it's holding up well
