BTCUSDT Bull if breaks above resistance BTCUSDT Bull if breaks above resistance
BTCUSDT Bull if breaks above resistance
BTCUSDT Bull if breaks above resistance
Bullish Flag

BTC BITCOIN USD : MASSIVE BULL FLAG, MEASURED MOVE TARGET $200KBTC BITCOIN is in a major bull flag on the macro. This is the bottom and we are going to see a serious move to the upside in a short period of time. Dont listen to everyone saying its going to tank, its all crap. Bitcoin always goes against the crowd and if youve been in this space long enough then you should know that. When everyone is bearish Bitcoin ALWAYS does the opposite, and the same for when everyone is bullish Bitcoin takes a shlt. This bullflag is massive and is going to propel BTC to some serious new all time highs. I cant wait to see the faces of everyone calling for a further drop lol its priceless watching backtrack. Also Bull Flag patterns are one of the most reliable patterns in trading. This is not financial advice this is just my opinion and what I am doing. If you like this content then leave me a like and follow for more updates and analysis. Thank you

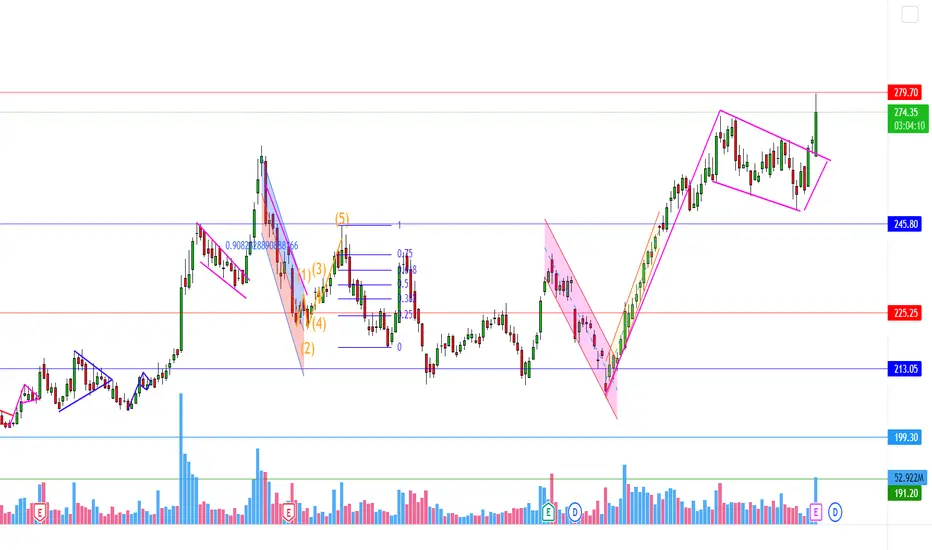
$ETH is forming a bullish descending channel!* If the price heads lower, we can expect a bounce from the circled area.
A break above this channel would be bullish.

DXY Breaking To The Upside DXY has just broken through to the upside and it is hitting resistance with 90 EMA. This isn't looking too good for BTC in short term, as we've seen in the past when DXY goes up then BTC goes down. If DXY breaks through above the 90 EMA, then we could expect this week to be somewhat a red week for BTC.

CADJPY BULL FLAG CADJPY looking to rise higher on CAD beating its GDP anticipations and JPY losing value on the Bank of Japans policy changes that have been spoke about. Technicals reflecting fundamentals well looking to even higher on this pair as marked

Price action analysis of SAILNSE:SAIL has been forming bullish flag structure from past 10 months and is finally broke the flag above it's higher boundary with good volume. This week it retested the upper boundary of flag and forming a support. Next leg could be upside with a great potential.

NZDUSD - Bullish Flag(22May2022)A Potential Bullish Flag pattern may form up and I'm going to wait and observe if the market retest 0.6367, this gives me a chance to engage the Flag Pattern Trade on the 1hourly chart(current timeframe).
If you are a trained Harmonic Patterns trader, you should be able to spot the Bearish Bat Pattern at the 4-hourly chart that is complete its Bat Pattern at 0.6523.

POUND- Higher by the end of the weekHello everyone
As USD loses it's value over the news from federal reserve,better prices for the pairs with this currencies can be seen allover the market.
For now, over the possibility of the exhaustion of the trend, we may have couple of RED bars in the way of our Bull trend, but since we have an OIO pattern( outside,inside,outside)it's more likely to have the market keep going up.
the resistance levels in the way are 1.25$ & 1.26$ (1.25$ will break IF the trend continues) and our support level is 1.23$.

AUD/NZD LongPrice broke a bullish flag within ascending channel , expect rise price until dynamic and horizontal resistance at 1.11700

Bullish Flag Breakout in ITCBullish Flag Breakout in ITC
Expecting more upside if break todays high
Todays high is very important
Oil 🛢 position Oil 🛢 goes in long potion with a target above 116 and bellow 117 , which I the next stop for the oil 🛢 in this bearish market.

Looks like a Bull flag.NASDAQ:RCMT
RCMT closed just above support if you ask me, you can see it on the 1H chart.
It broke out, came down to test the support and it holded. I am curious about tomorrow.
Huge volume shelf below for more support.
What is your opinion about RCMT let me know.

long in amazonwe see a break of bearish trend with a big volume so amazon can go to 2465 as a target

Bitcoin - Small bull trade ideaKeep it plain, simple and minimize the noise!
We nailed our last few trades! :)
Sorry for the phone upload, but here we have an inverse head and shoulder retesting the neckline with a bull flag (continuation pattern).
If we get our confirmations, my target is around 33k.
Also not surprised if we just nuke straight through this, as the market is clearly bearish.
At the moment - the market is sideways, choppy and RISKY.
I have various different set-ups I'm watching and always waiting for confirmations of each one BEFORE entering a trade.
Comment your ideas down below :)

EURJPY - Bearish Deep GartleyWithin the sideway consolidation, it does have a potential of a Bullish Flag Pattern formation, a retest at 136.93 will be a good enough price for me to get involved. The first target will go to the immediate high and the final target I'll stretch it to 139.71. That's the level of an AB=CD Pattern completion and coincides with the Bearish Deep Gartley Pattern.

SANDBOXSAND already breakout from descending channel, but i think sand will retest to strong support at $2.2 - $2.4
NOT FINANCIAL ADVICE
DYOR

SPX500Are we in a bull market correction? Or is this it & the big Crash is finally here? Have the chickens finally come home to roost?
What my video and comment below let me know what you think.

$RNDR fixing the rectanglerender token created a nice rectangle in the past days, and is currently retesting its support level @ $1.5 : if it breaks to the upside, we can expect a good uptrend bringing at least a 7% profit targeting the next $2 resistance, which is also the 0.382 fibonacci level
the rsi is not looking bad to me and it has much growth potential
let me know what you think about this idea!

market indecisionAfter breaking up the falling wedge yesterday, we saw a good bullish daily candle as I told, and we also had superficial support on 200 day moving average on 1hrs time frame.
Right now I see a bullish flag pattern on the chart and by breaking this channel upwards we will see a significant increase in price.
My only concern is the small volume entering the market, which is suspicious.
This is not a buy or sell signal, so open a position with your own management.

RUNE/USDT TRADE SETUP! BULL FLAG!!Hello everyone, if you like the idea, do not forget to support with a like and follow.
Welcome to this RUNE/USDT TRADE setup. RUNE looks good here.
RUNE is forming a bull flag-like structure where the breakout is still pending. It has an important support level of $6.6-$6.9. Expecting a pump from there.
Buy some now and add more in the range of $6.6-$6.9
Entry range:- $6.6-$7.2
Target:- 100%
SL:- $6.10
If you like this idea then do support it with like and follow.
Also, share your views in the comment section.
Thank You!

bullish flagEntry: $43.30
SL: $41.00 (loss 5.50 %) (visual only, close if daily closing price below) (but also a good investment)
TP: $55.70 (profit 28.4 %, ratio 5.1)
Hello Traders and Investors,
in my opinion, this setup also offers both a very good trading and a good investment opportunity.
The price formed a cup formation (without a handle) and is just about to break out of a bullish flag . Currently, a nice hammer candle can be seen on the weekly candlestick chart. Those who want to can get in, but waiting until the $45 level is broken is also quite smart.
For me, this share also offers a nice investment opportunity, as the dividend yield is over 3.5% and the fundamentals are also solid.
The share is listed in the S&P500 and the Nasdaq100 Index.
Deutsch
Hallo Trader und Investoren,
meiner Meinung nach bietet auch dieses Setup sowohl eine sehr gute Trading- als auch eine gute Investitionsmöglichkeit.
Der Kurs bildete eine Tassen-Formation (ohne Henkel) und ist gerade dabei aus einer bullischen Flagge auszubrechen. Zur Zeit kann man im Wochen-Candlestickchart einen schönen Hammercandle sehen. Wer möchte kann einsteigen, aber auch ein Warten bis zur Durchbrechung der 45$ ist durchaus schlau.
Für mich bietet diese Aktie auch eine super Investmentmöglichkeit, da die Dividendenrendite über 3.5% liegt und die Fundamentaldaten ebenfalls sehr solide sind.
Die Aktie befindet sich im S&P500 sowie im Nasdaq100 Index.

VET/USDT TRADE SETUP! BULL FLAG BREAKOUT!!Hello everyone, if you like the idea, do not forget to support with a like and follow.
Welcome to this VET/USDT TRADE setup. VET looks good here for a good upside potential rally.
VET is breaking out from the bull flag-like structure in the 8hr time frame. Expecting a 90-100% move to the upside here. Buy some now and add more in the dip.
Entry range:- $0.050-$0.054
Target1:- $0.062
Target2:- $0.074
Target4:- $0.084
Target4:- $0.096
SL:- $0.044
If you like this idea then do support it with like and follow.
Also, share your views in the comment section.
Thank You!

BTC TO 200K?did some research on specific structures that produced the biggest bull runs in btc history , one being about 35k% and another being 12%, we are currently in one of this mega bull run cycles on the weekly time frame.
i did some math to try and get the best price we can run up to, im not saying this will happen at all but given its track record the odds are very high of it completing this cycle at 200k.
