Bullish Engulfing PatternGood Morning!
What a great weekend! Futures opened with a slow melt up to an overnight high of 4723.25.
The daily formed a Bullish Engulfing Pattern.
Day2 opened lower than Day1 Close
Day2 body engulfs Day 1
Day 2 Bears controlled price in morning
Day 2 Bulls decisively took over price into close
White has small upper wick, price closed near its high price suggesting EOD price surge.
I'll be cautious of Trend Reversal around the pivot 4704/4705.
With FOMC on Wed and Quad Witching on Friday
There may be enough Sell pressure to form several black candles over the next few days signaling a Trend Reversal.
Gamma/Derivative experts confirm a new gamma floor around 4700 on Dec 8th suggesting we are in the left shoulder of a larger H&S pattern that could form with a strong xmas rally into the new year.
Vanna flows continue to be strong in the mornings providing the needed liquidity to create big movements up and down.
This suggests using large stops as the price will continue jolt up and down (as it just did at around 6:40am this morning).
This week I plan on studying more Order Flow and will begin to include some levels in the days to follow.
As always, Hope for the Best, Plan for the Worst!
Bullish Flag

BTC FLAG Breakout or Failure.. Trade for both shorts & longs non bias TA for both sides.. enjoy.. dont long or trade till the flag is BROKEN with VOLUME confirmation.

GALA=1$ Here is why...Hello every one
GALA/USDT
GALA has Done a Massive Pump Due To It's Great Gaming Project But It seems It can Increase Pretty Easily once again! As you can See The Price of GALA has Been Decreasing after It has created a New ATH a few Days ago! But This Correction has Formed a Bullish Pattern which is a Bullish Pennant pattern! The Break out has not Happened yet So we can not Be sure weather our Predictions Will come True Or Not! But If The Break out happens Upwardly, We can See GALA to Reach 1$ Pretty Easily and Afterward Probably 1.10$! There is also a Hidden Bullish Divergence (+HD) On MACD as well Which Helps The Bulls To Make a Decision .
Summery:
-GALA's Bullish Movement is Not Over!
-Bullish Pennant is visible on The Chart.
-No Break out!
-Easy Target=1$
-Resistance at 1.10$
-(+HD) on MACD
💎Traders, if you liked this idea or have your opinion on it, write in the comments, We will be glad.
Things can change...
The markets are always changing and even with all these signals, the market changes tend to be strong and fast!!
Thank you for seeing idea .
Have a nice day and Good luck

BULL & BEAR FLAG PATTERNSBULL FLAG
This pattern occurs in an uptrend to confirm further movement up. The continuation of the movement up can be measured by the size of the of pole.
BEAR FLAG
This pattern occurs in a downtrend to confirm further movement down. The continuation of the movement down can be measured by the size of the pole.
Please don't forget to like, comment and follow to support us,
GoldViewFx
XAUUSD TOP AUTHOR

Mask Bullflag, possible breakout pending (4 hr char)Hello, Mask has dropped significantly. Now it has formed a bull flag on 4 hr chart. An increase in volume can cause a significant gain. Not a financial advice

PBR going out of the bullish flag + Wyckoff LPS and test. 07.12.2021
NYSE:PBR
GFS 70,69
with the bullish flag formation, which the price exited already, there's a good chance of the price going higher if it brakes the $11.14 point.
Often a bullish flag suggests Wyckoff reaccumulation, which is evident here, with the price reaching the 'TEST' in the last phase last week. I'm keeping my eyes for longs this or next week with PBR.

NIFTY - FLAG in making, Wait and Watch is better for nowTRY TO SEE MEDIUM TERM TREND, SUCCESSFUL CLOSING ABOVE 15100 (W), WILL CONTINUE THE BULL RUN FOR MINIMUM 3-9 MONTHS... NIFTY HAS VERY HUGE TARGETS MAY BE 18K ON CARDS
Take this opportunity to start adding quality shares in every dip/correction
DON'T PANIC, IF YOU ARE AFRAID OF CORRECTION - SWITCH OFF TV ... LOOK FOR OTHER THINGS, DON'T LOOK AT MARKET FOR A MONTH
1 DAY COVID STORY HAS TO GO AWAY... HAVE PATIENCE...

GBPJPY Bull Scenario 2 expected - oversoldHello Traders
Here is a new BUY Scenario, oversold signals coming from the RSI and the Stochastics.
This pair is quite oversold, i expect a bullish move, maybe until 149.800 - 150.000
Over this price, i think it will go down further between 136.000 and 132.000
💹GBPJPY BUY STOP
✅ Entry @149.000 or above
✅TP-1# 149.200
✅TP-2# 149.400
✅TP-3# 149.600
✅SL# 148.400
JamdeJam will not accept any liability for loss or damage as a result of
reliance on the information contained within this channel including
data, quotes, charts and buy/sell signals

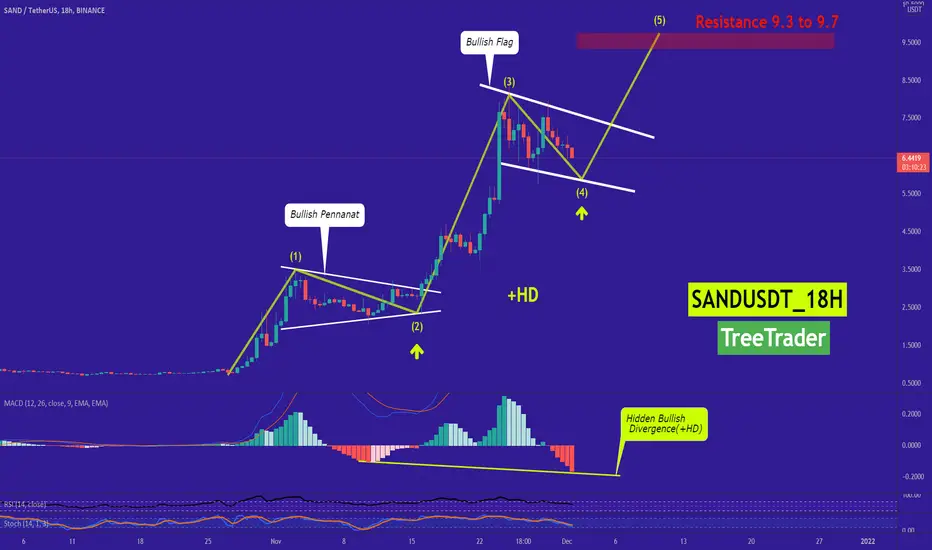
SAND can Reach 9.7$Hi every one
SAND/USDT
SAND has done a Massive Bullish Movement Recently But It seems There is Room For Bulls For another Bullish Wave! as you can See The Price has been Increasing Beautifully according To Elliot Waves Principle! The First 3rd Impulse waves Has Been Completed,The Price is In The 4th Impulse wave Right now which is a Correction wave! after The 4th wave is completed which is Expected to happen in a Few days, The 5th wave Will be Started & the Bullish Wave can Increase Up to 9.3 or 9.7$. Not Only The Elliot Waves Suggest This, But There is also a Bullish Flag on The chart which Suggest The Same Price Prediction! The Price was In a Bullish Pennant Not Long Ago & It worked Perfectly So There is a High chance That The Same Thing Happen Here with This Flag! There is also a Hidden Bullish Divergence (+HD) On MACD as well! all Evidences Suggest a Bullish Movement For Sand ! The 5th Wave and The Bullish Break out can Happen Soon and We shall See SAND reach 9.7$!
Summery:
-SAND's Elliot Impulse waves Suggest a 9.7$ Target
-Bullish Flag also Suggest The Same Target
-(+HD) On MACD
🔴This is only an idea and not a financial advise ( NFA )🔴
💎Traders, if you liked this idea or have your opinion on it, write in the comments, We will be glad.
Thank you for seeing idea .
Have a nice day and Good luck
Big weekly close coming upJust moments before the weekly close ether is looking insanely bullish. I feel like we are witnessing the start of eth making a big move against bitcoin.

#SQ Bull Flag SetupSquare has been hit really hard lately but the good thing is the chart has painted for us a really nice Bullish Flag setup to add to our watchlists for a reversal or a breakout to jump in with shares or for my option traders like myself a good call setup, i'm looking at the FLOW on Unusual Whales closely to see when to jump in exactly Especially now that Jack Dorsey has stated this will be his main focus moving forward it paints good picture for the outlook of SQ.

#UNFIUAST #UNFI#Crypto Idea ; 032
#Binance Exchange
##UNDIUSDT
#UNFI
Must Wait For Buy Zone
#UNFIUSDT Have 105.31 % Profit Potential With 2nd High Profit Golden Tp
#UNFIUSDT Chart
Keep in mind.
🟢 Multiple Rejection Structure
🟣 Monthly Frame Structure.
🔴 Weekly Frame Structure.
🔵 Daily Frame Structure.
🟡 4.H Frame Structure.
⚪️ 1.H Frame Structure.

CRO Holding Support And Accumulating Nicely - Breakout to $1.20!CRO has been accumulating very strongly and holding on support even as BTC fell yesterday due to Omicron fears. CRO looks like it’s at the bottom and I do not believe we will dip past the next Fibonacci support level of .67. We are primed for a breakout soon and I’m still eyeing a massive move upwards this month!

🔥 SAND Bull-Flag Pattern: Break Out SoonOver the last two weeks, SAND has seen some consolidation after a massive run up in the four weeks prior to that.
During this consolidation period, a bull-flag pattern has appeared on the chart. With SAND bouncing off the lower support earlier today, I think that the pattern has been confirmed and that we're going to follow this in the near future.
For now, we will see some more bullish price action towards the resistance of the pattern. A bearish bounce is to be expected from there since the pattern is not finished yet.
Later in the weekend we might scout for a break out, ideally a bullish one with a big green candle. Target placed at the most recent high.
Happy trading!

Bull Flag on MATIC STF - upside target to 2.131?Descending channel on STF which will like reach the bottom of the Fib retracement at 1.922 or the 1.982 Fib at least
Upside target of 7.29% based on the flag pole - US$2.131
Downside risk less since we are already at the end of a significant retracement from the last pump

BTC/USDTBTC is still bullish in Day1. possible 70k ATH in December 2021.Closing above 70k will goes up to 80k

#SKLUSDT #SKL#Trading ID ; 030
#SKLUSDT
#SKL
#SKLUSDT Now in Buy Zone #SKL Have Hidden Bullish Divergence on 30M Time Frame
Proof
Keep in mind.
🟢 Multiple Rejection Structure
🟣 Monthly Frame Structure.
🔴 Weekly Frame Structure.
🔵 Daily Frame Structure.
🟡 4.H Frame Structure.
⚪️ 1.H Frame Structure.


ETH/BTC BULLISH!ETH/BTC Looking great after breaking out of my BULL FLAG formation.
Target is set, it is currently testing the break of RESISTANCE and turning into SUPPORT.
You can see the CUP & HANDLE pattern played out on the larger TF.
This is BULLISH for ETH and ALTS.
NFA.

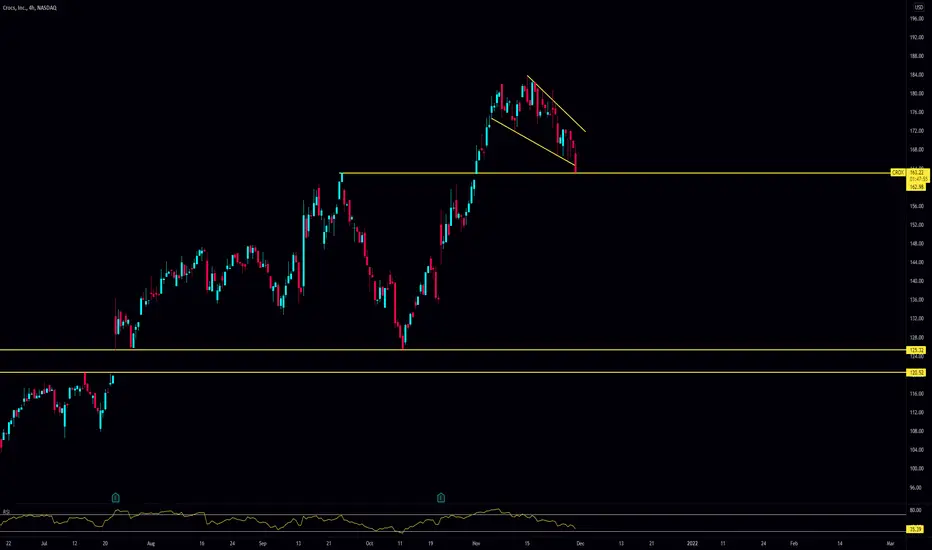
$CROX - Bull Flag into Key Level of Support$CROX recently put out an awesome earnings report which caused a run to new ATHs. Afterwards, we formed a bull flag, and started approaching a key level of support.
This level of support may provide the necessary bounce needed to break out of the flag, and continue charging upwards. Will be keeping a close eye on this one.
BlokusdtWhat's your idea about BLOK ?? is it the next gem of metaverse ??
I think I have a huge potential for growth

BTC Bull Flag low timeframeBTC has formed a bull flag after hitting resistance at 58k. Next breakout to 59300 or more. Continuing the bigger predicated movement in previous trade idea.

BTC Bull Flag Breakout ConfirmedTread Idea - Short Term
BTC has broken bullish out of a bull flag on the hourly and 4 hourly.
This gives us a target to our next zone of resistance around 60K.
We have some serious catching up to do for the S2F model to get to an average price of 100K by year end.
On-chain = Bullish, TA = Bullish but very high levels of derivative positions around so the next move will be volatile in the markets decided direction.
Happy hunting,
TheRaggy
