Bitcoin is about to take off! Get Ready!Bitcoin continues to repeat itself. Will it do it again?
The current RSI has formed an almost identical pattern as it did in September. During this time it was forming a descending wedge/pennant/triangle.
Currently we are near the apex of an identical wedge and the RSI reset almost exactly like this at the end of September before it took off from 39K to 69K.
We also appear to be bottoming out on the Bollinger Bands, as we were in September before making a 30K move.
The first wave up was 23K and the second wave up was 30K.
I anticipate a breakout move to 80K from here. That would be about a 25K move from the bottom(assuming 55K is the bottom).
Bullish Flag

GME Channel, Feb ForecastThis is the channel that GME is currently trading in. My forecast is a gap higher late Jan or early Feb perhaps to the $450 range. I am very bullish on this stock. Shorts have not been covered and the SEC will forever allow them to kick the can. This will happen until the stock price reaches unthinkable levels. MOASS or not, I'm holding this stock as my #1 holding for 2022. Other picks LRC, MANA, AMC, AVNT.TO, SOL, BTC, ETH


BTCBTC Update.....
I'm new here.....
What you think about this Idea? Are you agree with me? Please let me know.
N:B: I'm not your financial adviser.
Thank you

BTCUSDT Bullish Pattern.BTC Update...BTC going 100K!?
Please check Properly then you can understand perfectly.
What you think about this Idea? Are you agree with me? Please let me know.
N:B: I'm not your financial adviser.
Thank you

BTCUSDT Bullish Pattern.BTC Update... BTC going 100K!?
BullFlag, Big Triangle & Big Cup&Handle Pattern...BTC will hit new ATH if any pattern is followed.
Please check Properly then you can understand perfectly.
What you think about this Idea? Are you agree with me? Please let me know.
N:B: I'm not your financial adviser.
Thank you

Intel Corporation, INTC. Good time to buyINTC good time to buy at low price, before return back to its original up-trend after months of down- trend

Allcargo - Trade The FlagOur First stock in Trade The Flag - Allcargo
Allcargo Logistics is a leading multinational Company engaged in providing integrated logistics solutions and offers specialized logistics services across multimodal transport operations, inland container depot, container freight station operations, contract logistics operations and project and engineering solutions.
The company has a healthy dividend payout record.
Net profit has increased to the tune of approximately 239% over last financial year.
As compared to sales ending in Q1, sales increased by 1529 in Q2 and with improving conditions post covid-19 scenario:
Expected revenue growth of 33.53% for next year
Expected earnings growth of 54.32% for next year
Hopefully with another stellar performance in the coming half of the year we can see the price rising to 500 levels.
The price has already made an all time high and since has been moving in a sideways zone a break out above suggested levels would definitely take the price soaring high.

DKNG - Bullish Flag SetupDKNG - is another company that i reviewed a while back on my youtube channel and after digging in the business model made me even more bullish on them, however they had a little bit of a side step when it came to earnings but what W/S didn't consider is that the promos DKNG ran when going into the new added states was the amount of promotional money DKNG put up for that when considering the numbers showed as it losing ground there also MAU Deposits when down due to them getting free money to sign up and after them having to fund money did not end up meeting the mark in either case it was an over reaction and the price has struggled HOWEVER as we can see this is a bullish flag setup which have a tendency to break to the top side i know those things are guaranteed but it still makes for a good play to throw in your watch list and if starts to make a push to the top side throw some money into some calls to take advanctage of those gains, in addittion to this Cathie Wood and her ARK fund has not stopped adding to their very large position with dkng

CRV Curve after formin a bullish penant. Send it to 7$Curve looking strong.
After left the Zone 3,60 - 3,80$ and formin a nice Bull flag; bullish Penant, falling wedge... and break out... we will se a new ATH to 7,15 - 7,72 $
Be careful of a retest...
ReX Trading

HOT's Bullish Potential!Hi every one
HOLO / TETHER
HOT has Formed a Bullish Pattern! This Bullish Pattern is a Bullish Flag! The flag has the Potential To Increase the Price of HOT as much as the measured Price Movement which is The Flag Pole Here. But since Break out has not happened yet, we can not Rely blindly on it! wait for a break out & than Enjoy a Easy Profit!
🔴Summery:
-HOT is in a Bullish Flag!
-It can Increase as much as the Flag Pole!
-No break out yet!
💎Traders, if you liked this idea or have your opinion on it, write in the comments, We will be glad.
Things can change...
The markets are always changing and even with all these signals, the market changes tend to be strong and fast!!
Thank you for seeing idea .
Have a nice day and Good luck

BTC - Mini-Flag Confirmed - Bear Wick at ResistanceBTC's break-out of the Bull Flag was met by sellers at the break .35, which was in-line with the previously resistance at the 100% Diamond Reversal Break Target. Awaiting a compression pattern, or iH&S to form to illuminate a bull path.

AMC BULL FLAGGING ??AMC bigg bull flagging what yall think ?? id say good entry point here long on some calls ?? risk break of trend >>

USDJPY - Head and Shoulders PatternUSDJPY is one of the rare charts that has all three Major timeframes, namely the Daily, the 4-hourly and the 1-hourly chart in Bullish Trend.
While the 4-hourly chart has a Bearish Head and Shoulders setup, at this moment the structure holds.
Trend Traders or traders who are looking for a buying opportunity can wait for a Double Bottom with RSI Divergence forms at the projected completion of Head and Shoulders to engage the trade.

BTC - The Weekend in 3D - Mini-Bull Pennant ConfirmedBTC found support, after a bear flag broke to the downside, at the Diamond Pattern Break Target 1.618. Price has broken-up out of a min-pennant back-testing a cross of the 2h MBB and 8 EMA. The 2h 50 SMA sits above right below the UBB at 59-2 - 59.5.

BTC - GeoTech Fibonacci Worksheet in 3D - Mini PennantPrice found support at the H&S Break Target Channel .236, with resistance at the Channel Golden Pocket. Forming a mini-bull-pennant under 2h MBB resistance.

Bitcoin Bullish Flag has formed on 2hr chart/ Fear & Greed indexbitcoin Bullish flag has been seen on 2hr chart frame. if btc break the resistance coming in around 58400 and closed the daily candle, then the technical price target will be coming in 61500. btc need to break the resistance level of this bullish flag to change the trend.
on the other hand, fear and greed index has hit the level of fear at 37 point, it is a bullish sign.

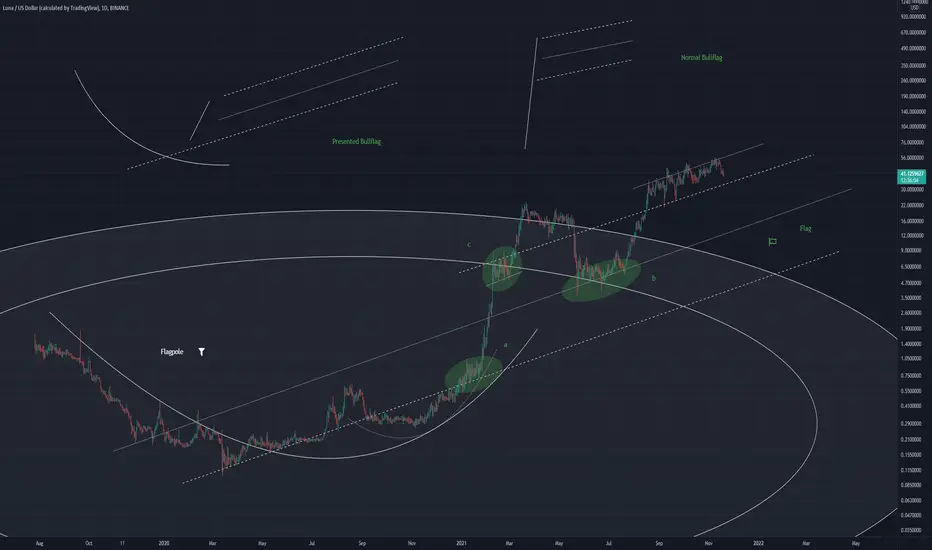
LUNAUSD Exploring BullflagsA strange flag has presented itself again
Only at closer look can you see flag properties, I have displayed them above
LUNA is sitting above the 4.618 Fib level, with this large bullflag structure, encompassing the whole price history
The curved flag pole is a new idea, but it works perhaps if the flag was facing descending rather than ascending
Algorand could breakout anytime$ALGO has been lagging behind in price action lately, after a pullback from it ATH of $2.50 level.
A symmetric wedge is currently forming on the daily chart, and with Bitcoin being pumped about 15-20% since last week, it time for money to enter alts.
With excellent technology and fundamentals $ALGO is comparable to the likes of $ADA (Cardano) which currently captures approx 70B market cap.
Short term: ATH coming soon, Medium term: I see $ALGO going up to $8-$10

TSLA levels and projectionsThe only thing to fud this up is Elon tweeting and selling his remaining 5 percent he needs to sell. In the meantime, that can happen within 2 days or 2 months. Until he needs to pay taxes So I'm just gonna ignore it for now and just play cautiously
Bear case:
~IF TSLA breaks the red support line we could see a dip back to 1000
~Note 1000 is a huge psychological level of support and will most likely be bought up if it dips below.
~As we have reached a higher high, I would not anticipate to see price going lower than 1k even disregarding mentality.
Bull case
~if we break above the green line, we broke out of a bull flag.
~We could rise to fill the gap at 1200
~We will meet some resistance at the 1126-1130 zone, but if that is broken, we officially have an inverse Head and shoulders on TSLA.
~Expect resistance at 1130, and if so be prepared to be trading in an upwards bearish wedge.

AMZN Monthly Bullflag Breakout!This bullflag is a longgg time in the making. Might mean some strength for AMZN in the coming months if the next candle opens above the zone it has rejected every other time it tried!

Macys Bullish FlagCheck my prev post about $M for more details.
On D chart I see bullish flag. It can be a good spot for fast long trade. (+5-15%)
But be care with support line. If we broke it - it can be some down-trend on Dividends date.

Potential Bull flag on MANA!The previous resistance reached by MANA might be revisited again once the price breaks through it's bull flag. but DON'T entry yet, wait for the breakout to occur or buy at the support of the flag
