Bullish Flag on USD/JPY @ D1A bullish flag has formed on the daily chart of the USD/JPY currency pair (US dollar vs. Japanese yen). It can be used for a trend-continuation breakout trade should the price close significantly above the flag's upper border before invalidating the pattern. The flag and its pole are shown with the yellow lines. My potential take-profit level is marked with the green line. My potential stop-loss level is marked with the red line.
Bullish Flag

Just realized I never posted these targets.I was looking back through my ideas and realized I didn’t see a published version of the breakout targets for the weekly bull flag I’ve been watching for awhile now…So I decided to post one now. I’ve been saying this for months now but once we flip the top trendline of the channel which is also the flag of the bull flag to solidified support thereby confirming the breakout that we had 2 huge targets to look forward to. The first one around the 64k level is the breakout target just for the channel itself. The bigger target at 97k is for the entire bull flag. As with most pattern breakouts on this large of a time frame it can take multiple months sometimes to reach the full breakout target. Rest assured though we have most definitely confirmed this breakout and we should hopefully see the channel target reached in the next few weeks and the flag target reached within 2 months time. Just a rough estimate on my part but I’m confident we will eventually reach both targets.

EUR/JPY Signal - EUR Trade Balance - 9 Nov 2021EURJPY has traded into support prior to the French Trade Balance data, which shows the difference between imports and exports. Technically price is at channel support, trading in a bull flag pattern. Structure also supports price above 130.470. We anticipate a bounce into previous support turned resistance.

IS StarLink will be Next 10x Coin of MEtaVerse ..?$STARL/USDT Chart:-
#StarLink/UsDT Chart looking super bullish.
#Bull_Flag Pattern
And Its will be next 10x-50x coin.
But Don’t Invest Too much Amount.
I am investing only $500 and Forget for mid term with Stop Loss also.
Entry:- $0.000038-$0.000042
Targets:- 2x-10x
Stop Loss:- $0.000030
Support:- $0.000038

SHIBA INU is forming flag expecting breakout soon!!TECHNICAL ANALYSIS: #SHIBAINU (4hrs update)
In 4hr timeframe, Shib has Been in Bullish Trend & at the Moment, Consolidating in Flag from local top.
#shiba is Forming Bullish Flag Which is a Continuation Pattern So In Case of Breakout, Expecting Another +50% Bullish Wave ahead (Maybe in mid November)
Expecting More Consolidation so SHIBA Might retest the 0.00003955-0.00003656k Area Before Final Bullish Wave.
🥰If you find this helpful and want more FREE forecasts in Tradingview😍.
Please show your support back🙏,
Hit the 👍 LIKE button,
Drop some feedback below in the comment✍️!
❤️🤝 Your Support is very much 🙏 appreciated!❤️🤝
💎 Want me to help you become a better Crypto trader?
Now, It's your turn!
Be sure to leave a comment; let me know how you see this opportunity and forecast.
Trade well, 💪
#SHIBCOIN #CRYPTO #BULLISHRUN #ALTCOIN #UPTREN #SHIBARMY

BTC in 3D - Weekly Worksheet - Bull FlagThe Bull Case; Bull Flag has formed, looking for continuation and to test ATH. The Bear Case: follow the path of the previous Cloned Bull Flag that broke Bear, to retest the H&S Neckline.

USDJPY LONG IDEA1.Price has broken out of a descending channel - 90% chance of it going to the top of structure
2. Bullish flag - another descending channel so 90% rule again
3. At an area of daily support

If it's a Bull Flag, it's a huge numberIf we chart this recent stretch to a bull flag and it holds above 62K then we see a 20K run up to 82-85K at the minimum. Of course the volatility in BTC is always a challenge.
At this time we are waiting for a ATH and close above in order to set our stop loss at BE. We are long from 63K

Bullish Flag on BTCUSDBullish flag on Btc. We had some what of a downtrend then price found some support around 39368, then started to rally back to the upside. Formed a Higher high giving us a BOS break of structure. Then somewhat of a divergence on the rsi on the 4Hr TF forming higher highs but price is clearly showing lower lows within the flag. Price reacted soon as it reached the key level of 60018.46. I placed my stop loss below the spring/manipulations which was another indiction of buyers in the market, and aimed for 1.5 RR.

Shiba Inu SHIBUSDT - Bull flag + Double TOP- SHIBA INU - SHIB - Rank #11 - Token.
- On the chart we can spot a huge rising wedge on the LOG scale.
- Also the chart is printing a bull flag / bullish pennant!
- Crypto market usually ends with a double top / double bottom, so there is still a space to go.
- I would not buy Shiba inu, it's just a technical analysis.
- For expected duration of the trade, probability, stop loss, profit target, entry price and risk to reward ratio (RRR) - please check my signature below ↓
- If you want to see more of these ideas, hit "Like" & "Follow"!

Link LINKUSD - Ascending channel + Next profit target +500%!- Link is very bullish on the weekly time frame.
- We can spot an ascending channel forming on the weekly timeframe.
- Previous swing high acted as a support + bottom of the channel!
- Profit target is top of the channel.
- If you take a look at RSI we can see, that this oscillator is ready for another pump!
- For expected duration of the trade, probability, stop loss, profit target, entry price and risk to reward ratio ( RRR ) - please check my signature below ↓
- If you want to see more of these ideas, hit "Like" & "Follow"
- The price is currently breaking out of the symmetrical triangle!

$MU vs $AMD part 2*This is not financial advice, so trade at your own risks*
*My team digs deep and finds stocks that are expected to perform well based off multiple confluences*
*Experienced traders understand the uphill battle in timing the market, so instead my team focuses mainly on risk management*
My team has been covering $MU for the past few months. After consolidating in the $65-$75 range for the past couple of months we finally believe that $MU is ready to take its leap to go past $100.
$MU is a semiconductor company much like $AMD. With this being said investors should expect these two to uptrend similarly short-term along with other semiconductor companies this winter due to a chip production increase.
For long-term investors $AMD is the chip tyrant that will most likely dominate its competition, but that does not mean we can't still make money off $MU.
My team entered $MU at $72.92 per share at market-close on Friday. Our first take profit is set at $92 per share.
OUR ENTRY: $72.92
FIRST TAKE PROFIT: $92
2ND TAKE PROFIT: $103
If you want to see more, please like and follow us @SimplyShowMeTheMoney

$LODE earnings analysis*This is not financial advice, so trade at your own risks*
*My team digs deep and finds stocks that are expected to perform well based off multiple confluences*
*Experienced traders understand the uphill battle in timing the market, so instead my team focuses mainly on risk management*
My team has been analyzing gold and silver company Comstock Mining $LODE for the past few months. Our guys love the ignitor bar that $LODE made at market close on 11/5/21. We have been waiting for such price-action to happen so that my team can enter $LODE for a long-term trade.
My team entered $LODE at $2.25 per share and plan to take profit at $4.50.
$LODE is expected to announce 3rd quarter earnings on 11/8/2021 but this date is subject to change.
OUR ENTRY: $2.25
TAKE PROFIT: $4.50
If you want to see more, please like and follow us @SimplyShowMeTheMoney

BTC/USD: Shoulder Head ShouderIn H4 timeframe we see a Shoulder Head Shoulder (Inverted) and also, I look a bullish flag channel in H1 timeframe. But now, I want to just enfocous in H4 timeframe, we look another bullish perspective for Bitcoin price.
Meanwhile, in Daily timeframe, we closed up with a bullish hammer candlestick. For the moment, there's not any bear signal that Bitcoin drop to $56,000 USD key support level to long term by bulls.
Also, as we look this bullish flag channel, we see a break out and pull back in this zone at $62k level.
This it's the break out and pull back in H1 of this bullish flag channel. It's bullish signal in the Bitcoin price.
I entry in long position in the market price live with the SL at $60,867 USD and my own target at $69,709 USD
Good luck!!!

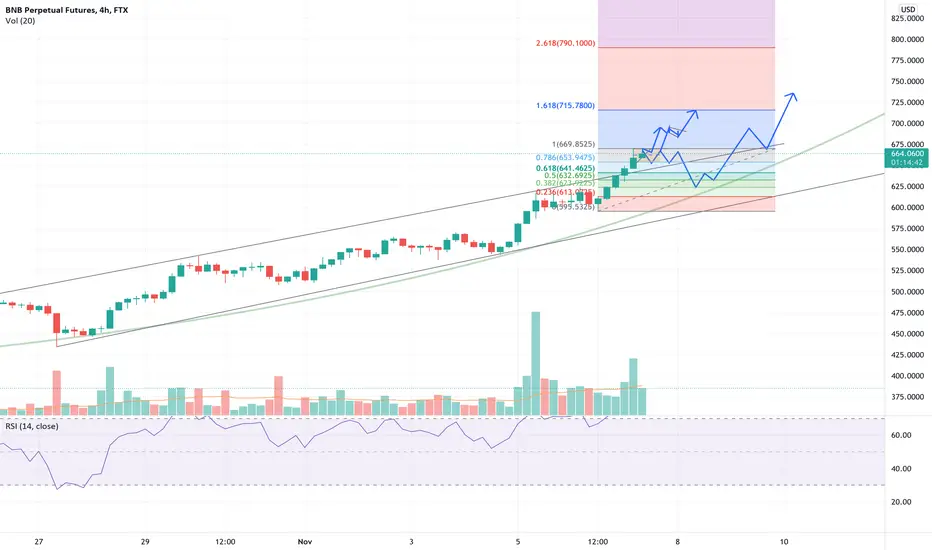
I am Bullish on #BNB | #BSC #BAKE #CAKEHello Padawans,
First of all do not take this as a piece of financial advice.
I am really bullish on crypto.
But I am bit neutral till a breakout.
Let's see what's gonna happen.
Cheers.
May the force be with you,
Litecoin LTCUSD - 5000% gains + Road to 10 000 USD + Triangle- Litecoin - LTC - Rank #17 - Coin
- If we take a look at the chart, we can definitely spot an ascending triangle.
- We have very important double top resistance right at the ALL TIME HIGH level.
- Litecoin is prepared for a huge pump!
- We need litecoin, because bitcoin transactions are very expensive.
- That's why everybody uses litecoin at this moment. (Paypal, ATM machines etc..)
- RSI is prepared for a next pump!
- 1:1 FIB extension = 1750 USD Profit target.
- For expected duration of the trade, probability, stop loss, profit target, entry price and risk to reward ratio ( RRR ) - please check my signature below ↓
- If you want to see more of these ideas, hit "Like" & "Follow"!

Ripple XRPUSD - Elliott Wave + Ascending channel- On the chart we can spot an Impulse Elliott Wave and ascending parallel channel!
- As you can see we are currently at the 5th wave to the upside, which can be huge!
- For expected duration of the trade, probability, stop loss, profit target, entry price and risk to reward ratio ( RRR ) - please check my signature below ↓
- The coin started this uptrend by the Head and Shoulders pattern.
- Target is top of the channel or 1:1 fib extension!
- New all time highs are near than you think.
- The volume is decreasing, which means, that a big explosive move is coming!
- If you want to see more of these ideas, hit "Like" & "Follow"!

SHIB/USDT : Back into range zone, Bull flag formed !BINANCE:SHIBUSDT
Hello everyone 😃
Before we start to discuss, I would be glad if you share your opinion on this post's comment section and hit the like button if you enjoyed it !
#SHIB has retested the 0.618 FIB's level on logarithmic chart and now it's bounced back into range zone from the daily demand.
Also it's formed a 2H demand in HTF demand zone !
Based on current range zone, #SHIB will bounce back to the range high zone after a retest on lower support zone located at the range zone's bottom.
- Also you can wait for a breakout on bull flag that formed on 6H's time-frame :
The bullish flag has formed on the 6H's chart and flag pole is target $0.00009600 and above !
If you're not a day-trader, Then you can wait for flag breakout and enter the retest of flag...
🔴 Don't forget to manage your risks, Suggested risk for this trade is 2% or lower !
Hope you enjoyed the content I created, You can support us with your likes and comments !
Attention: this isn't financial advice we are just trying to help people on their own vision.
Have a good day!
@Helical_Trades

SHIB to the MOON! A Little Patience pleaseFirst of all this is my first publish. Please feel free to comment and correct if you saw some mistakes. Happy to hear all the bad and good voices.
After SHIB's first raise it swing for 16 days and created a bull flag. During this flag creation it tested the bottom 2-3 times but mostly swing b/w 0,5 and 618 fib levels.
I believe we are following a similar bull flag. Today it tested the bottom line and bulls ate the bears.
I am not giving you any trading idea Just sharing my thoughts. I thing it still may come back to 0,059 and bounce back to the fib 0,5 levels but when the time is done it will break the upper triangle and test the ATH once more.
In case of a drop below the triangle could not be eaten this time then it may go back to 0,059 - 0,053 and 0,047
Wishing you all a profitable journey.
BR

BTCUSD bull flag What Is a Bullish Flag?
Bullish flag formations are found in stocks with strong uptrends and are considered good continuation patterns. They are called bull flags because the pattern resembles a flag on a pole. The pole is the result of a vertical rise in a stock and the flag results from a period of consolidation. The flag can be a horizontal rectangle but is also often angled down away from the prevailing trend. Another variant is called a bullish pennant, in which the consolidation takes the form of a symmetrical triangle.
The shape of the flag is not as important as the underlying psychology behind the pattern. Basically, despite a strong vertical rally, the stock refuses to drop appreciably, as bulls snap up any shares they can get. The breakout from a flag often results in a powerful move higher, measuring the length of the prior flag pole. It is important to note that these patterns work the same in reverse and are known as bear flags and pennants. Bull flags typically begin to surface in conjunction with a new market rally.

4 bullish patterns on xrpusd could have a breakout domino effectThis is a classic bullish pattern domino effect. I everyone of these patterns breakout points converge like it appears they very well may, as one pattern reaches it’s measured move breakout target it will rigger the other pattern and so on and so forth. Ultimately, we need the pink horizontal line(inv h&s neckline) to be flipped to solidified support long enough to trigger the inverse head and shoulders bullish breakout. Once we can flip it to solidified support that is the signal that all fo these patterns will b e confirming their breakout. Until then however this could just be yet another convincing fakeout by xrp.

VeChain VETUSDT - Ascending triangle +1000% gains- VeChain VET - Rank #23 - Coin.
- The chart is printing an ascending triangle - bullish continuation pattern.
- As per my Elliott Wave count, we are in the 5th impulse wave to the upside!
- For expected duration of the trade, probability, stop loss, profit target, entry price and risk to reward ratio (RRR) - please check my signature below ↓
- If you want to see more of these ideas, hit "Like" & "Follow"!

