#BERAUSDT #1D (Bitget Futures) Descending wedge on supportBeraChain printed a bullish hammer that may have marked a double bottom here on daily.
Reversal seems around the corner, revisiting 50MA & 100EMA resistances would make sense.
⚡️⚡️ #BERA/USDT ⚡️⚡️
Exchanges: Bitget Futures
Signal Type: Regular (Long)
Leverage: Isolated (2.0X)
Amount: 4.8%
Entry Zone:
2.798 - 2.558
Take-Profit Targets:
1) 3.345
2) 3.848
3) 4.350
Stop Targets:
1) 2.120
Published By: @Zblaba
CRYPTOCAP:BERA BITGET:BERAUSDT.P #1D #BeraChain berachain.com
Risk/Reward= 1:1.2 | 1:2.1 | 1:3.0
Expected Profit= +49.8% | +87.4% | +124.9%
Possible Loss= -41.7%
Estimated Gaintime= 1-2 months
Bullishhammer

Hammer Candlestick: Meaning and SignalsHammer Candlestick: Meaning and Signals
Technical analysis is a commonly used approach in the financial markets. It involves studying historical price data to make informed trading decisions. Among the various tools and formations employed in technical analysis, the hammer candlestick pattern stands out as a powerful tool. This article will delve into the meaning of the hammer candlestick pattern and explain how traders can interpret it on a forex, stock, and crypto* price chart.
What Is a Hammer Candle?
A hammer is a candlestick that is found on trading charts. It occurs at the end of a downtrend and acts as a bullish reversal signal.
To identify a bullish hammer candle on a price chart, traders do the following:
- Look for a significant downward movement: They begin by searching for a notable decline in an asset’s price.
- Observe the candle shape: The setup is characterised by a small body near the top of the candle and a long lower shadow. The lower shadow must be at least two times the length of the body. The colour of the candle doesn’t matter, but if it’s a green hammer candlestick, meaning it closed higher than it opened, the signal may be stronger.
- Analyse the context: Traders usually look for areas of support nearby as they may increase the setup's reliability.
Bullish Hammer Pattern: Trading Rules
Here are the common steps traders take when trading with a hammer:
- Confirm validity: Traders ensure that the hammer meets the criteria discussed earlier, such as a significant market decline followed by a candle with a small real body near the top and a large lower wick.
- Determine the entry point: Once the bullish hammer candlestick is confirmed, traders identify an appropriate entry point. Candlesticks don’t provide specific entry points. However, traders usually wait for the subsequent bar to close above and enter the trade if the market moves higher.
- Set stop-loss and take-profit levels: Traders place a stop-loss order below the low of the hammer to potentially limit risks. Traders determine a suitable take-profit level based on their trading approach, such as at the nearest resistance level or in accordance with the risk/reward ratio.
Trading Example
A trader spots a hammer on the hourly chart of the EURUSD pair. They wait for the candle to close above the hammer to enter the market. Their stop loss is below the hammer’s lower shadow, with the take profit calculated in accordance with the 1:2 risk/reward ratio.
How Can You Confirm the Hammer Candlestick?
Confirming the hammer candlestick pattern enhances the reliability of trading decisions. Beyond its basic identification, several techniques and indicators help validate its potential bullish reversal signal.
- Volume Analysis: A significant increase in trading volume during the formation of the hammer candlestick suggests stronger confirmation. Higher buying volume indicates heightened interest and participation, reinforcing the potential reversal.
- Support Levels: The presence of a strong support level near the hammer adds credibility to the pattern. Support levels act as psychological barriers where buying interest may increase, boosting the likelihood of a reversal.
- Subsequent Candlesticks: Observing the price action of the next few candlesticks after the hammer can provide further confirmation. A bullish candle closing above the high of the hammer enhances its validity.
-Double Hammer Pattern: While rare, a double hammer candlestick pattern where two candles appear consecutively can offer strong confirmation of a bullish movement.
- Trend Indicators: Utilising trend indicators like moving averages can help confirm the hammer. A rising moving average confirming the upward trend or a hammer forming in line with a broader trend adds weight to the potential reversal.
- Divergence: Identifying divergence between the price and momentum indicators, such as the Relative Strength Index (RSI) or Moving Average Convergence Divergence (MACD), can strengthen the pattern's reliability.
Hammer and Other Candlestick Patterns
Let’s compare the hammer to other candle formations you can spot on price charts.
Inverted Hammer
The inverted hammer is similar to the hammer but has a different appearance. It is characterised by a small body near the bottom of the candle and a long upper wick. The inverted hammer signals a potential bullish reversal as buyers start to gain strength and push the market up. The small body and small lower shadow reflect the rejection of lower prices, suggesting a shift in market sentiment from bearish to bullish.
Doji
In contrast to the red or green hammer candlestick pattern, the doji features a small real body with equal or close opening and closing prices and long upper and lower wicks. It represents market indecision, where neither buyers nor sellers have gained a clear advantage. While the hammer is potent during the downtrend, the doji can occur after both uptrends and downtrends, and it signals market consolidation or a potential trend reversal.
Shooting Star
The shooting star formation emerges at the top of an uptrend and suggests a potential bearish reversal. It is identified by a small real body near the bottom of the candle and a long upper wick, implying a rejection of higher prices and potential exhaustion of buying pressure.
Hanging Man
The hanging man emerges after an uptrend and suggests a potential bearish reversal. It resembles the hammer with a small real body near the top and a long lower wick, but the crucial difference is that it occurs in an uptrend. The hanging man implies that sellers are starting to exert influence, potentially leading to a reversal in the market.
Limitations of the Hammer Pattern
While the hammer is a valuable tool in technical analysis, it is not without its limitations.
- False Signals: It can sometimes produce false signals, leading to premature or incorrect trade entries. In certain market conditions, such as strong downtrends or highly volatile environments, the hammer may be less effective. Its success rate can vary across different assets and market scenarios.
- Dependence on Confirmation: The reliability of the hammer significantly depends on additional confirmation tools and indicators. Without these, alone it might not provide sufficient confidence for trading decisions.
- Short-Term Nature: The hammer primarily signals short-term price movements and typically can’t be used to anticipate medium or long-term price trends.
The Bottom Line
Successful implementation of the hammer formation requires experience, practice, and the use of additional technical analysis tools and indicators. Traders never rely solely on the hammer’s signals but integrate it into a comprehensive trading strategy.
FAQ
What Is a Hammer Candlestick?
A hammer is a specific setup found in charts that indicates a potential reversal to an uptrend. It is formed when a financial instrument opens at a certain price and experiences a significant decline during the trading period but eventually rallies back and closes near its opening price.
Is a Hammer Candlestick Pattern Bullish?
Yes, the hammer candlestick pattern is generally considered bullish. It signifies a potential trend reversal after a downtrend, as buyers enter the market and drive the price higher from its lows. The long lower shadow indicates that the buying pressure is strong and can potentially lead to further upward movement in the market.
Can a Hammer Candle Be Bearish?
A hammer candle is generally considered a bullish reversal signal, signalling a potential upward price movement after a downtrend. There is no bearish hammer. If the market continues to move lower after it forms, it just means that bearish market conditions were stronger and didn’t allow buyers to change market sentiment.
What Is the Hammer Candle Rule?
The hammer candle rule states that it must occur after a significant downtrend, have a small real body near the top of the candle, and feature a long lower shadow at least twice the length of the body. This pattern indicates a potential bullish reversal if confirmed by subsequent price action.
What Is the Hammer Strategy?
The hammer trading strategy involves identifying a candlestick at the end of a downtrend, confirming its validity with additional indicators or signals, and then entering a long position. Traders typically set stop-loss orders below the hammer's low and determine take-profit levels based on risk/reward ratios or nearby resistance levels.
*Important: At FXOpen UK, Cryptocurrency trading via CFDs is only available to our Professional clients. They are not available for trading by Retail clients. To find out more information about how this may affect you, please get in touch with our team.
This article represents the opinion of the Companies operating under the FXOpen brand only. It is not to be construed as an offer, solicitation, or recommendation with respect to products and services provided by the Companies operating under the FXOpen brand, nor is it to be considered financial advice.

USDCAD ChartTrend is Bullish Trend. Price retraced to print HL, at HL there is Bullish Hammer so take Instant buy entry

#BTCUSDT #4h (OKX Futures) Descending trendline break and retestBitcoin just regained 50MA support and is pulling back to it, looks ready for short-term recovery towards 200MA resistance, especially after that bullish hammer.
⚡️⚡️ #BTC/USDT ⚡️⚡️
Exchanges: OKX Futures
Signal Type: Regular (Long)
Leverage: Isolated (5.0X)
Amount: 4.9%
Current Price:
57886.5
Entry Targets:
1) 57738.1
Take-Profit Targets:
1) 62483.9
Stop Targets:
1) 55359.4
Published By: @Zblaba
CRYPTOCAP:BTC OKX:BTCUSDT.P #4h #Bitcoin #PoW bitcoin.org
Risk/Reward= 1:2.0
Expected Profit= +41.1%
Possible Loss= -20.6%
Estimated Gaintime= 1 week

New York Community Bank: Bullish Hammer TestNYCB printed a Bullish Hammer followed by an Inverted Hammer at the low and has Bullishly Engulfed it, I now think there is a decent chance to attempt to use those Hammers as a Support which would act as a macro bottom and perhaps fill the upside gap. I will be buying At The Money Call LEAPS at the strike of $5.00 just to see if we can get anything out of this price action.


Third time lucky!!! Buying NatGasTrade Idea: Buying Natural Gas
Reasoning: Invesrse head & shoulders on hourly chart at major support level. Posted a bullish hammer on daily.
Entry Level: 3.722
Take Profit Level: 4.418
Stop Loss: 3.543
Risk/Reward: 4:1
Disclaimer – Signal Centre. Please be reminded – you alone are responsible for your trading – both gains and losses. There is a very high degree of risk involved in trading. The technical analysis, like all indicators, strategies, columns, articles and other features accessible on/though this site is for informational purposes only and should not be construed as investment advice by you. Your use of the technical analysis, as would also your use of all mentioned indicators, strategies, columns, articles and all other features, is entirely at your own risk and it is your sole responsibility to evaluate the accuracy, completeness and usefulness (including suitability) of the information. You should assess the risk of any trade with your financial adviser and make your own independent decision(s) regarding any tradable products which may be the subject matter of the technical analysis or any of the said indicators, strategies, columns, articles and all other features.

CSCO weekly bullish hammer at monthly support end of wave 5 downOrder BUY CSCO NASDAQ.NMS Stop 41.28 LMT 41.28 will be automatically canceled at 20230401 01:00:00 EST
CSCO weekly bullish hammer at monthly support end of wave 5 downtrend expect ABC correction upward. Area of confluence. Quick 1.2R countertrend.

CAD/JPY: UpdateCanadian Dollar/Yen Japanese still strength in H4 timeframe as we see a bullish hammer formation and this it's mean a bought, if you don't entry from yersterday, you can to entry now, and put your Stop Loss to $104.47 JPY and then, your take profit to $106.10 JPY.
We're early to buy!!!
Good luck!!!

XAU(GOLD) Longterm PredictionHi everyone
hope you have good moments
i have an longterm idea on GOLD according to price action levels
and Elliot Wave Analyze.
first lets look at Wave analysis.
we can see above an impulsive wave that seems to be ending.
and after that we expect a deep ABC correction for this compelete cycle.
i show this ABC in my chart.
there are another possible shapes for this ABC but i illustrate one of them above.
after that lets go to keep an eye on price action.
GOLD bounces from 1680 support strong with 2 candlestick patterns:
1)bullish engulfing
2)bullish harami
so we expect to grow approch 1790 resistance first.
probably after that we will see a correction again (WAVE B) and then break this level
toward 1860 resistance.
this level is the end of wave 4 from prior impulsive wave
and the level 50% retracement of impulsive 5 wave too.
with a deep look we see 200 day Moving Average around this level.
so if something unnormal dont happen , we see this level soon.
notice that interest rate set to 0.75 upper to 2.5 and the market price this rate before.
and seems inflation peaks and will be go down in front months.
dont forget to manage your risks.
our first duty is protect our capital after that we think about profits.
thank you all for reading my opinion.
tell me your criticism in comments and i will be happy.

Is $CAL ready to move higher after pulling back?Notes:
* Strong up trend since 2020
* Great earnings in the recent quarters
* Pays out dividends
* Creating a base for the past ~14 months
* Recently bounced from its 200 day
* Pulled back to its 50 day and is now showing signs of recovery with volume
* Historical resistance comes in around 29.85
Technicals:
Sector: Consumer Cyclical - Footwear & Accessories
Relative Strength vs. Sector: 2.83
Relative Strength vs. SP500: 3.88
U/D Ratio: 1.4
Base Depth: 66.55%
Distance from breakout buy point: -6.6%
Volume 27.64% above its 15 day avg.
Trade Idea:
* You can enter now since volume's coming in as it bounces from its 50 day line
* If you're looking for a better entry you can look for one around the 27.3 area as that would be ~50% of the bullish pin bar we got in the last session
* This stock usually has local tops when the price closes around 21.42% above its 50 EMA
* Consider selling into strength if the price closes 21.22% to 21.62% (or higher) above its 50 EMA
* The last closing price is 5.76% away from its 50 EMA

Matic 1D chart possible incoming Resistance levelsHello frieand.
like you see in my shared chart , matic is in a disjoint channel and runnung sideways.
nowadays we are in the mid-line of this channel and we see a strong bullish Hammer in this position.
also we see very good volume and its possible they are buyers!
if we go upward the first important resistance level is 0.5500
and if we cross this level we will reach about 0.6700.
please share your opinion and improve my skills friend.
we together can rise up.
help each other to grow.
teach me something new.
i will be happy.
thank you all my dear friends.
!!!NOTE!!!
MY POSTS ARE NOT TRADING AND INVESTING ADVISE
SO TRADE ON YOUR OWN STRATEGY AND CONSIDER MARKET RISKS.

$XENE showing signs of going higher after a long consolidation!Notes:
* Strong up trend
* Okay earnings track record
* Consolidating for the past ~9months
* Bouncing from its 50 day line with bullish momentum
Technicals:
Sector: Healthcare - Biotechnology
Relative Strength vs. Sector: 1.73
Relative Strength vs. SP500: 1.32
U/D Ratio: 1.97
Base Depth: 36.27%
Distance from breakout buy point: -1.16%
Volume 19.91% above its 15 day avg.
Trade Idea:
* You can enter now as the price is still close to the 50 day line
* If you're looking for a better entry you can look for one around the $32.76 area as that seems to be a pivot
* This stock usually has local tops when the price closes around 33.16% above its 50 EMA
* Consider selling into strength if the price closes 32.96% to 33.36% (or higher) above its 50 EMA
* The last closing price is 10.55% away from its 50 EMA

The Bulls are in Control! 😀Hey Traders,
As you can see on the daily candles of Litecoin (LTC). The All Candlestick Pattern has revealed there was a candle with a long longer shadow. This is when the bulls bring the price action to a lower close of the bears sell off indicating control of the bulls. Very good chance to buy in!
Safe Trading,
-Pulkanator

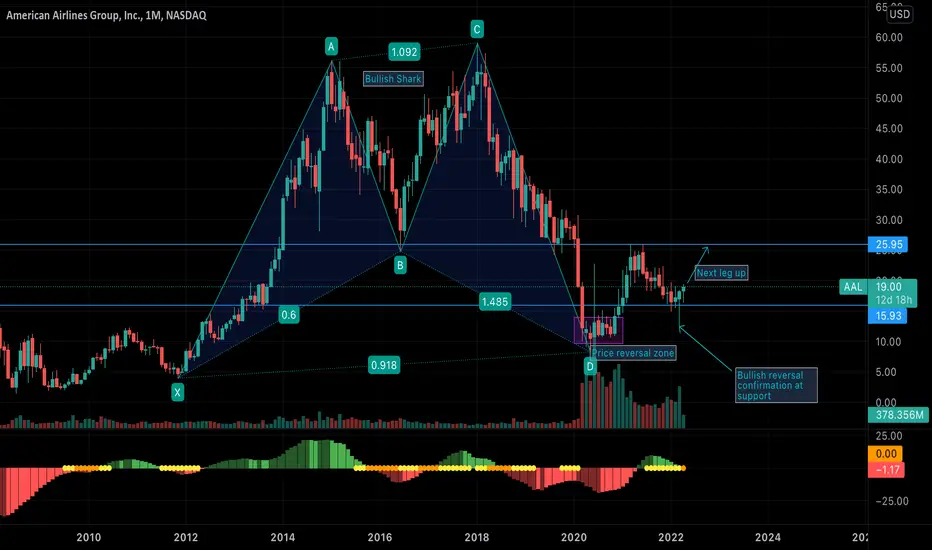
AAL - Bullish reversalNASDAQ:AAL had been in a downtrend since march 2018. After the significant dip in march 2020, buyers shown good interest in it and kept the price above 10 for couple of months, making a strong support level. Bullish shark harmonic pattern has also been formed and price reversed from PRZ(Price Reversal Zone) level. Price marched up to meet the demand of buyers and faced resistance around 25.80 which was a previous support level. Price retraced for couple of months but with low volume. Finally, in march 2022, price did a strong reversal from 16$ support level with a significant volume making bullish hammer. That marks a higher swing low and is a strong indication of a bullish reversal and price is likely to go up to 26$ for a short term target. If it break 26$ level, then a strong bullish trend can be seen.
BCRX Bullish Hammer Candle and MACD + ADX DivergencesMy favorite long term bio setting up for a bullish move.
Price bounced off support with a bullish hammer candle on higher relative volume, with bullish divergences on both the MACD and ADX.
Possible long setup in the short term.
Entry: 11,30 area
Short Term Target: 12,80 area
Stop loss: 10,50 area
--
Fundamentally I expect this to go $100+ by 2025.

Bullish Hammer at PCZ of Gartley with Hidden Bullish DivergencePTON Had a crazy dump day the other day and lots of v9olume sold out of the stock we then spent a few days at the 78.6% retrace and we now seem to be getting a reaction, so long as we close the day like this, this should be a good bullish signal to enter. i will buy some shares and some calls here.

AMC Possible Bullish HammerToday AMC experienced a volatile strong start all the way to $41.94 which was near my .618 resistance although I was wrong because I thought perhaps $41.10 was more of the resistance. And then dip harshly today. Even so today AMC played my falling wedge. Now with today price action $AMC broke down the bull liquidity zone of $39 to $38.82 in the last 30 minuts but was quickly recover in the last 15 minutes and closing at $39.23. Interesting I notice a bullish hammer today closing of the the 30 min chart at $39.23 similar to the closing red candle that close at $39.15. What I expect tomorrow is a strong reversing. Otherwise any more lower dips either cause a falling wedge extension or I have to readjust. I will adjust if any changes occur.

AMZN Long position#AMZN bullish signal
Position: long
Entry price: 3320-3350$
Target price: 3500-3540$
RSI: approaching 30 which is oversold territory
Keltner Channel: the price at the lower boundary of the channel
Candle pattern: bullish hammer
Conclusion: Candle pattern, RSI and Keltner Channel suggest a pullback to the upside. Long position is recommended on the lower band area with the target zone at upper boundary.
Provided analyse is for an informational purpose only and should not be taken as a professional financial advice.

CCIV / LCID After Merger: Bullish Hammer Above 50MA and AVWAPThe merger between NYSE:CCIV and LCID has been approved today and the stock will trade under LCID from Monday.
A classic Bullish Hammer candle has formed taking support on the 50 day SMA and the AVWAP (Anchored VWAP) line anchored at the base since the merger was announced. Still the ticker is trading below AVWAP lines from the recent high, all time high and the first ever significant hike in January this year.
In my humble option, LCID needs to deal with these important resistances at $25, $27.40 and 28.90 price levels if we are hoping for a significant run. So far the Bullish Hammer above the above mentioned support levels is a good start. It has also broken out of the downward trend line that it has been following since the recent high.
Let's hope for the best! Also please let me know your opinion on it.
Thanks!

Bitcoin make support above of $61,000 USDIn H8 timeframe, Bitcoin it´s still above of $61,000 USD. We see in H8 timeframe that Bitcoin formed a bullish hammer.
s3.tradingview.com
We can to see that in Daily timeframe it´s loo bullish. That could be just the correction. We´re in this trade

bullish hammerwe have a bullish hammer on 15 minute chart i think tomorrow gonna be a good day!!!!!!

3 of 3 Candlestick Patterns That Pinpoint ReversalsBullish Hammer Candlestick
These candles are easy to spot and they generally have taller wicks than their bodies, resembling a hammer's handle and head.
They tend to close without (or with very little) upper wicks.
Here's what a bullish hammer candlestick is telling us:
Price opened near the highs of the candle and although sellers initially succeeded at pushing price lower, they lost the final battle when buyers tipped the scales in their favor again by closing price higher than the opening price.
