Cup and handle patternBreaks cup and handle pattern and going up. Looks bullish. Make sure to do your own analysis and maintain your risk management. This is only for educational purposes
Bullishmomentum
BUY POSITIONToday im looking at buy positions to the highlighted target continue to make higher highs

IRB INFRA: Cup & Consolidation Breakout🔍 Chart Analysis
The stock formed a textbook cup pattern, indicating accumulation after a long downtrend and also given 200 EMA breakout.
After forming the rounded base, it entered a tight consolidation range (highlighted in blue).
Today, the stock broke out of this range with strong bullish momentum and rising volume.
Immediate support lies at ₹49.25, the base of the consolidation box.
Next major hurdle: Strong resistance at ₹60.52, which aligns with a previous swing top.
📈 Why This Setup Looks Promising
Cup and handle patterns often precede major upward moves, especially when breakouts happen with volume.
Breakout from consolidation confirms bullish interest near ₹53 zone.
The stock has already corrected about 47% from its all-time high, offering a potential value opportunity if trend reversal sustains.
🎯 Levels to Watch
Support: ₹49.25
Resistance: ₹60.52
Breakout Confirmation Zone: ₹53.00–₹54.00
⚠️ Disclaimer
This is not investment advice. Please do your own research or consult your financial advisor before taking any position. The market is subject to risk and uncertainty.

Market breakdown: SPY & Current TradesIn today’s update, I go over the general outlook on the indexes, focusing on SPY, Nasdaq, and Dow Jones — all still moving in bullish confluence. Even after three distribution days, there’s been no major downside move, but we are seeing drying volume, so caution is key.
I also break down some of my current trades:
A few aren't performing as expected, and that’s part of trading. We won’t win every setup, and that’s okay.
Red-marked trades have been removed from the watchlist and will be monitored closely for irrational moves. I may cut losses if needed.
Green-marked trades are still active and aligned with my criteria, so I’ll likely continue to invest in them.
Lastly, I cover a trade that recently hit my take-profit (TP), specifically KEROS, which has now also been removed from the list. ✅
Thanks for watching another one of my videos, I hope you gained value from the breakdown!
Comment below if you have questions or your own thoughts on the market.
Let’s grow together.

Cup and Handle Breakout in THOMAS COOK (INDIA) LTDTHOMAS COOK (INDIA) LTD is showing a classic Cup and Handle breakout pattern on the daily chart.
🔍 Chart Highlight
Breakout from the Cup's rim around ₹169.93 level.
Strong bullish candle with +7.61% gain, backed by higher volume.
Price sustained above the 200 EMA (₹163.85).
Next potential resistance: ₹197.29, a previous swing high.
Levels to Watch:
Support Zone: ₹163.85 – ₹169.93 (200 EMA + breakout retest zone)
Resistance Zone: ₹197.29 (next swing high)
If the price retests and holds above ₹169.93, it could offer a good risk-reward opportunity with ₹197+ as the near-term target. Keep an eye on volume and any pullback toward the breakout zone.
⚠️ Disclaimer:
This idea is for educational purposes only and not financial advice. Please do your own research or consult your financial advisor before making any trading decisions. Markets carry risk — trade wisely!

Equity Research Report – NEWGEN SOFTWARE TECHNOLOGIESShort-Term View: A strong breakout above key resistance at ₹1,100 with volume surge indicates bullish momentum. Price reclaimed the 50 EMA after consolidation. RSI at 60.87 supports strength; next resistance lies near ₹1,193.90.
Long-Term View: Structurally strong after correction. Sustaining above ₹1,020 (50 EMA) may attract fresh buying. Long-term targets can stretch to ₹1,300+ if earnings and demand trends remain favorable.
Conclusion: Bullish momentum likely to continue both short and long term. Watch for volume confirmation and hold above ₹1,100.
For Education Purpose only

XAUUSD Correction Phase May Present Upside PotentialOn the 1-hour timeframe, I estimate that XAUUSD is currently at the end of wave v of wave (c). This suggests that the recent correction is relatively limited, having already tested the 3096–3122 area. Going forward, XAUUSD has the potential to strengthen toward the 3192–3250 zone.

Bullish Momentum
Closing above Trendline around 133 - 134
would keep it Bullish.
Upside targets can be around 150-160.
However, breaking 131 will bring more
selling pressure towards 113 - 115.

Bitcoin (BITX) getting ready for a parabolic move? Here is a chart of probably my favorite swing trade for the year.
I am keeping it simple with this chart though. I am a firm believer in simple when it comes to trading. I think the previous descension and breakout is playing out very similarly to the current one. Both had a double top rejecting from their respective trendlines following the initial breaks of structure. BITX is currently making its second tap of the the trendline. If it plays out like the previous structure did that would suggest w could see one more low in store.
I don't believe this to be the case but if it is this run could be postponed until the end summer/beginning of fall. I think it is more important to point out the relative strength in Bitcoin as of late, the weakness in the US dollar, as well as global liquidity having broke out months ago.
I think the most likely scenario is a pullback from this point which will be followed by a higher low printing. I will say I also expect this pullback to be steeper than the one from the previous descension. Bitcoin and Indices are a lot more overextended than they were last time around and the structure in indices is a lot weaker than before.
All this being said I am expecting a breakout to occur over the next several weeks just based off probabilities. It all depends on if BTC and indices and hold their respective demand/support levels. Bitcoin needs to hold 85k in order for a summer breakout to occur. For the S&P equivalent level this could be somewhere around 5200-5300.
If these assets are not able to hold these levels my confidence will shift pretty dramatically. I would still expect a major rally to take place around the Q4 timeframe but I would be expecting a lot less upside. Price would likely have to chop around for a while before deciding if it wants to continue to the upside. I am basing this off market structure/Dow theory. It is important to take all possibilities into account and ultimately let the charts do the talking.

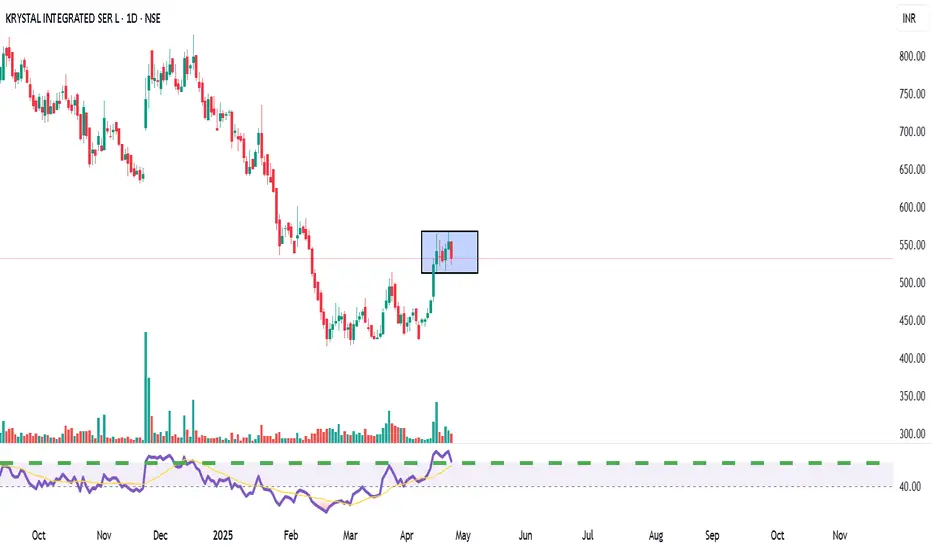
KRYSTAL Integrated Services LtdTechnical View: KRYSTAL is consolidating between ₹520–₹550 after a rally from March lows. A breakout above ₹560 could target ₹600+, while a dip below ₹500 may weaken momentum. RSI shows moderate bullishness.
Fundamental View: FY24 revenue grew ~44% YoY to ₹981 Cr; net profit rose ~26% to ₹48 Cr. ROE ~18%, ROCE ~20%. Recently secured a ₹349 Cr 3-year contract from Tamil Nadu Medical Services.
Action Plan:
Short-term: Buy above ₹560, target ₹600.
Long-term: Attractive valuation; accumulate on dips ₹450–₹500 zone.
Revisiting Bitcoin CyclesAs you can see we might be half way of the bull market phase for this cycle(green emas). These green emas reflecting the bull phase have been increasing in duration over history. This time we might see it lasting for about 1000 days. We are currently about 500 days since this green trend started , so we might see the best coming soon. Once these emas shift to green it will mark the start of the downtrend. Make sure to take some profits once we are approaching to day 1000 or you will have to wait about 4 more years to see these prices.

Daily and weekly poised for a bull run, BULL FLAG $SKLZPersonally see 6.89-7.33 in the coming weeks potentially 9$-10$ by summer with momentum and positive ER. SKLZ is a sleeping giant
Many analyst say its a buy and the chart is bullish for a 6month swing trade easy or a great long term position. Final time we see south of 5$ !?
We shall see, in time

The chart #MANEKIUSDT looks strong📉 LONG BYBIT:MANEKIUSDT.P from $0.002990
🛡 Stop loss: $0.002772
🕒 Timeframe: 1H
📢 Market Overview:
➡️ The token broke out impulsively after consolidating above the Point of Control (POC) at $0.002253 — a strong bullish sign.
➡️ The BYBIT:MANEKIUSDT.P stop-loss is set just below the key accumulation zone, at $0.002772 — a logical support level.
➡️ The volume profile shows heavy interest below current levels, indicating buyer support.
➡️ Current price ($0.002915) is slightly below the entry zone but testing resistance around $0.002944.
➡️ A breakout here could quickly push price to TP1 and TP2.
🎯 TP Targets:
💎 TP 1: $0.003100
💎 TP 2: $0.003210
💎 TP 3: $0.003300
📢 Watch for confirmation above $0.002944 — this would open the way toward TP1.
📢 Weak breakout may trigger a retest of the entry area.
🚀 The chart BYBIT:MANEKIUSDT.P looks strong — bullish momentum could continue!

Idea for Mon 14 Apr - Gold Short – Bear in a Bull OutfitOANDA:XAUUSD
Gold has been heavily influenced by recent developments in the trade war.
A 90-day pause on tariffs (excluding China) and the exemption of smartphones and computers from tariffs were announced on friday.
These headlines may temporarily calm markets and give stocks room to rise — which typically puts pressure on gold. If Dollar is rising again, could be a side effect too.
This could lead to a short-term pullback in gold prices.
A price gap was formed around $3175.51 during the opening session on Thursday, April 10th.
After a small bounce, i expect gold to move downward to fill that gap.
A potential support level is sitting near $3156, which could act as a bounce zone.
"Next week it’s a bear inside a bull outfit."
Despite a broader bullish structure, we could see the week start with a correction. A classic gap-fill setup for the short-term traders.
RSI and MacD are on top levels, but for how long?
-------------------------------------------------------------------------
This is just my personal market idea and not financial advice! 📢 Trading gold and other financial instruments carries risks – only invest what you can afford to lose. Always do your own analysis, use solid risk management, and trade responsibly.
Good luck and safe trading! 🚀📊

TSLA 45M chart - BULL flag Coiling for Breakout!www.tradingview.com
🚀 TSLA 45m – Bull Flag Coiling for Breakout
NASDAQ:TSLA TSLA ripped from $214 → $276 📈 and is now forming a bull flag just under resistance at $276.87.
🔹 Strong volume on the pole, cooling off during flag 🧊
🔹 RSI ~74 — strong, but not overheated 💪
🔹 MACD crossover 🔄 + momentum building 📊
🔹 Above all key EMAs (20/50/100/200) 🟢
🔹 OBV trending up — smart money is loading 💼📦
⚠️ Breakout above $277 = launch toward $293–$300, with extended target of $310–$330 if trend continues.
❌ Invalidation below $263.
📌 Watching for a breakout + retest entry 🔁
Let it cook. 🔥

10-20% upside possible in fortis health Fortis health chart is too strong.. in daily chart & in weekly chart they creat very bullish patterns.
Buy fortis health at 650-668
Target 727 749 835
Sl 600

Ethereum (ETH/USD) Bullish Breakout – Eyes on $2,500+ Target 📈 Chart Overview:
Timeframe: 4H (Ethereum/USDT)
Trend Reversal: Ethereum has broken out of a falling wedge pattern, indicating a shift from bearish to bullish momentum.
Support Level: Around $1,800 - $1,900, where price previously found strong buying interest.
Retest Confirmation: ETH successfully retested the breakout level (~$2,020), confirming a potential bullish continuation.
Resistance Zone: The next key resistance area is around $2,250, followed by a potential move towards the $2,530 - $2,550 target zone.
📊 Trade Setup:
Bullish Bias: Price action suggests an upward move towards $2,250 and potentially $2,530.
Risk Management: A stop-loss can be set below $2,020 to minimize downside risk.
🔥 Conclusion: If Ethereum maintains momentum above the retest zone, it could see a strong rally in the coming days! 🚀

Stock is Bullish but Currently moving in a Rectangular Channel.Stock is Bullish but Currently moving in a Rectangular
Channel.
Crossing 426 may lead it towards 450 &
Sustaining 450-455 may lead it towards 490 - 500.
However, breaking the Support of 360 will lead
it towards 290 - 300 where a Double bottom formation
can be seen.

#VICUSDT shows signs of reversal and strength📉 LONG BYBIT:VICUSDT.P from $0.2507
🛡 Stop loss $0.2470
🕒 1H Timeframe
📍 Important Note:
Wait for confirmation around the $0.2507 level. Enter the trade only if price holds above with volume.
✅ Overview BYBIT:VICUSDT.P :
➡️ The chart shows a completed Falling Wedge — a bullish reversal pattern that typically leads to an upside breakout.
➡️ After that, a Bearish Pennant formed but failed to push the price significantly lower, indicating weakness in sellers.
➡️ Currently, the price is breaking out of the triangle pattern, hinting at a possible bullish continuation.
➡️ Entry level marked at $0.2507, right after the breakout zone, supported by steady volume and short-term uptrend.
➡️ Volume Profile on the left reveals a low-volume zone above, making it easier for price to climb toward TP targets.
🎯 TP Targets:
💎 TP 1: $0.2525
💎 TP 2: $0.2545
💎 TP 3: $0.2565
⚡ Plan:
➡️ Monitor price reaction at TP1 — partial exit recommended.
➡️ Watch for confirmation above $0.2507.
➡️ Enter LONG after retest and volume confirmation.
➡️ Set stop loss below recent low — at $0.2470.
🚀 BYBIT:VICUSDT.P shows signs of reversal and strength — holding above the breakout zone could lead to upside movement!

Bullish on Bigger Time Frames.Bullish on Bigger Time Frames.
Immediate Resistance is around 126 - 127.
Potential to touch 200 is 127 is Sustain on
Monthly Basis.
On the flip side, 101 - 111 is the Support level
(if it takes pressure now.
Now it should not Break 89.

Still BullishRetested the Previous Breakout Level
around 37 - 38.
Immediate Support is around 46 - 46.50 now.
Monthly Closing above 48.20 would be
very healthy sign; targeting around 55.
& then around 60.

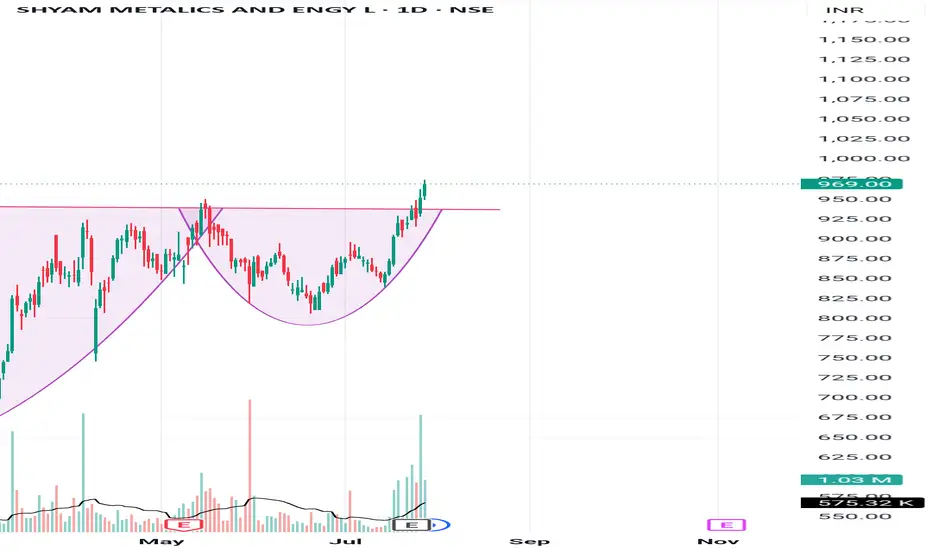
Weekly Closing just at Resistance!Weekly Closing just around Resistance
level (580), so a slight pressure may be seen, unless it
Sustains 580. If this be the case, 545 - 565 can be witnessed.
Bullish on Weekly TF & a perfect
Morning Star Formation on Weekly Tf.
Also, it has retested the previous breakout level
around 520.
Now it should Cross & Sustain 605-606 to continue
its Bullish Momentum & immediate targets can be around
650 - 655.
On the safe side, 596 - 621 Zone is a Resistance zone.

#FORMUSDT: Quick Breakdown of a Long Setup!📉 Long BYBIT:FORMUSDT.P from $1.9037
🛡 Stop Loss: $1.8313
🕒 1H Timeframe
⚡️Overview:
➡️ Current Price: $1.8831 — this is where BYBIT:FORMUSDT.P is trading right now.
➡️ The price recently dropped from around $2.0000 to $1.4000 — a sharp decline! But then it started recovering and is now in a consolidation zone.
➡️ Volume: At the bottom of the chart, you can see volume bars. There was a particularly large volume at the $1.4000 level, where the price reversed. This suggests a lot of activity — possibly big players starting to buy.
➡️ Key Levels: The right side of the chart shows important price levels:
➡️ $1.8313 — stop loss to protect us from losses.
➡️ $1.8932 and $1.88313 — the nearest resistance levels that the price needs to break to move higher.
➡️ $1.7464 — a support level below, in case the price goes down.
🎯 TP Targets:
💎 TP 1: $1.9690
💎 TP 2: $2.0400
💎 TP 3: $2.0890
⚡️ Plan:
➡️ Entry Point: $1.9037 — this is the level to enter the buy. The price is currently slightly below ($1.8831), so we need to wait for it to rise to this mark.
➡️ Stop Loss: $1.8313 — if the price falls below this, the trade will close with a small loss to minimize risks.
Risk/ Reward: If we calculate, the distance from the entry to the stop loss is $0.0724, and to TP1 — $0.0653 (a ratio of nearly 1:1). To TP2 — $0.1363 (1:1.88), and to TP3 — $0.1853 (1:2.56). This is a good profit potential if the price moves up!
📢 The BYBIT:FORMUSDT.P price just bounced off the strong $1.4000 level, where there was high volume. This could be a signal that big players started buying, and the market is ready to rise.
📢 The $1.9037 level (entry point) aligns with the POC (Point of Control) — the zone with the highest trading volume, which often attracts the price.
📢 If the price breaks the resistance at $1.8932, it could easily reach $1.9037 and then move toward our targets.
🎯 How Does This Signal Relate to the Market?
The recent news about the resolution of the #Ripple vs. #SEC case, which I wrote about earlier, creates a positive backdrop for the entire crypto market.
➡️ When major projects like #Ripple gain clarity, it adds confidence to investors.
➡️ Altcoins like BYBIT:FORMUSDT.P can catch this wave of optimism.
➡️ If the market continues to rise, BYBIT:FORMUSDT.P has a chance to break resistance and move toward our targets!
➡️ Important: The crypto market is volatile, so don’t forget about risk management. Don’t risk more than 1-2% of your deposit on a single trade.
