What is ICT Order Block and How to Trade it
👉🏻 ICT order block is basically an area on the price chart which indicates the huge institutional orders and signals the strong reversal or continuation of price.
You can use the order block as a confirmation of your trade entry or for the reversal of price.
In this article, we will teach you all about order block trading strategy from definition to its identification and to use along with examples.
You can jump to the part of this guide, you are most interested in or you can continue reading the whole article :
Table of Contents 👇🏻
1 : What is ICT Order Block?
2 : Types of Order Block
3 : Bullish Order Block
4 : Bearish Order Block
5 : Bullish Order Block Trading Strategy
6 : Bearish Order Block Trading Strategy
7 : Final Thoughts
What is ICT Order Block? ⚡️
ICT Order block is the area in the price chart, where a large number of orders are executed by institutional traders in the market and market shows sudden strong move from that area.
Retail traders follow institutional foot prints, so they wait for these order block zones to buy or sell in the market & make profit along with big institutions like banks.
You can see the example of order blocks in the picture given below :
Types of Order Block
As you know market has two price moves bullish & bearish. So on the basis of price moves, order block is divided into two types.
(I) Bullish Order Block
(II) Bearish Order Block
Bullish Order Block
A bullish order block is the last bearish candle before the bullish impulse (strong sudden) move, it typically consist of two candles, with the first candlestick being a bearish and the second candlestick being a bullish one.
How to Identify a Bullish Order Block? ⚡️
To identify a valid bullish order block you need to check following things.
(I) Second candle being a bullish candle, should grab the low of previous bearish candle. Price should go below the low of previous bearish candle.
(II) Second candle being a Bullish candle should close above the high of previous bearish candle.
(III) Imbalance in lower time frame in the order block zone.
(IV) Structure shift in lower timeframe.
To sum it up we can say, second candle should completely engulf the first candle – body to body & wick to wick.
You can see the example of bullish order block in the picture below :
Bearish Order Block ⚡️
A bearish order block is the last bullish candle before the bearish impulse move, it typically consist of two candles, with the first candlestick being a bullish and the second candlestick being a bearish one.
How to Identify a Bearish Order Block? ⚡️
To identify a valid bearish order block you need to check following things.
(I) Second candle being a bearish candle, should grab the high of previous bullish candle. Price should go above the high of previous bearish candle.
(II) Second candle being a bearish candle should close below the low of previous bullish candle.
(III) Imbalance in lower timeframe in the order block zone.
(IV) ICT Market Structure Shift in lower timeframe.
To sum it up we can say second candle should completely engulf the first candle – body to body & wick to wick.
You can see the example of bearish order block in the picture below :
Bullish Order Block Trading Strategy ⚡️
In bullish order block trading strategy you would look for shift of price delivery from bearish to bullish and then execute a buy trade utilizing a bullish order block.
When the trend is bearish and it approaches a demand zone where you would seek reversal of price and at that area price shifts its structure to the buy-side.
Then you will be looking for the order block at the bottom of the impulse move which changed market trend.
When you find the bullish order block in that move, it means it was a move involving institutions so you need to wait for the price to test the bullish order block zone to execute a buy trade.
When price retraces back and tests the bullish order block zone you can execute a buy trade as shown in the picture below :
When tradin bullish Order block trading strategy your stop loss will be 10/20 pips below the low of order block zone.
Bearish Order Block Trading Strategy ⚡️
In bearish order block trading strategy you would be looking for the shift of trend from bullish to bearish and then execute a sell trade utilizing a bearish order block.
When market trend is bullish and it approaches a supply zone where you seek reversal of price and at that area price shifts its structure to the sell-side.
Then you would look for the order block at the bottom of the impulse move which changed price trend.
When you find a bearish order block in that move it means it was a move involving institutions so you need to wait for the price to test the bearish order block zone to execute a sell trade.
When price retrace back and tests the bearish order block zone you can execute a sell trade.
A real market example of bearish order block trading strategy is shown below in the picture.
Final Thoughts⚡️
When trading using bearish Order block trading strategy our stop loss will be 10/20 pips above the high of order block zone.
Order blocks can also be found in a trend after a pull back and these order blocks confirm the strength of trend. We can use these order blocks to trade the trend or to add new positions in the trend.
Like in a bearish trend after a bullish pullback a bearish order block may form, which confirms the strength of bearish trend and we can add a new sell order to enjoy the bearish trend.
Likewise in a bullish trend after a bearish pullback a bullish Order block may form which confirms the strength of bullish trend and we can add a new buy order to enjoy the bullish trend ❤️ .
Bullishorderblock

XAUUSD|Trading positions in multi-time framesHello guys, I hope you are doing well. We have the gold chart in 1 hour time frame:
For gold, if you remember, we had an bullish order block area, which moved up well upon reaching this area, and it has also started to move up in the return to the candlestick that was formed in one hour and the demand area was formed.
The point that is important in the one-hour timeframe is the level (2030), which is a resistance on the way of gold.
But if we have a close candle above this level, we can hope for its upward trend until the next supply area, which is around (2038-2041).
In the time frame of 15 minutes, we have the refined area of that one-hour supply area, which we can enter selling positions when the price reaches this area.
In the 4-hour time frame, we had a support, and when we reached it, we moved upwards. As long as it is maintained, gold can achieve higher targets, but if this area is broken down, the numbers that can be expected are the supply areas (2005 -2008) and the next area (1990-1995).

29.5K PIVOT POINT After many days of sideways choppiness between 29 & 29.5K. The pattern was broke sending us into that FVG I have mentioned in previous posts with a target of 26.5K. However, having dropped down to 28.5k and back up to 30k in 11 hours some volatility has been reintroduced into the market in the short term.
I have mapped out a mini range that I am observing, the 29.5K pivot is still the controlling factor in my mind. Now that price has deviated above and is now back in range printing a SFP, in addition to a bullish orderblock that is providing a reaction as the time of writing this post. I still think we have some downside to come should this reaction now clear the pivot point of 29.5K
Because of this, I am still confident that reaching the 26.5k target is possible. Regaining 29.5k confidently and proof that it is now support would make me reconsider this strategy.


#GBPUSD - GO LONG AFTER THE FALL? - *SMT**SMT = smart money theory = see relasted tutoprial regarding what smart money is. Sm,art money is how the charts can be manipulated, and how y0ourself can be manipulated into believing a false sense technical analysis.
With the price dropping in one day what iyt gained over the course of the week. The price has dropped below sell side liquidity levels, but to remain bullish needs to stay above a CERTAIN BULLISH ORDER BLOCK LEVEL, otherwise we could see the price turn right back around and go down for GBP, but I think the BOE will be quicker to adapt to the FED knowing the consequences now. S I would guesss that it is moving up into the the hourly fvg and then will get rejected above the premium by smart money, amnd that point it dips a little further, as to where y09ou can enter a second time afgter taking profit the first time around 1.22665 Enter again near 1.21420 if possible and continue to ride this up to 1.26090 to be safe.
I have two entries
both at 1.21420
First one reaches what is said above and you take your fiorst profit there, it could slip back down to the entrance or even further, into a small fair value gap below which I have prepared for on the second entry,. and ther stop losses at 1.21120 & 1.20525
the second run with the deeper stop loss also has a much larger target at 1.26090 ner the top of the bearish order block. the R:R is 6:1 and 5:1 respectively, so if this woprks out t he way I ho [e it doers in the next week or two, 10% can be added top the account if played correctly.
I was once the smarrt money student who has become an instructor. Let's Hope my intuitions are correct about thias.
With that said if you hit the first take profit but go out on the second sdtop loss, you should still be at a winning ratio. It's about how to grow yojur account. Everyday you won't hit a homerun. But if y0ou hold the bat long enough, the ball will go far.
Cheers, Good Luck and Good trading.

$ETH - Bearish to start the week - Bullish to end *SMT*EDIT: MY BNAD FOR NOT STRETCHING OUT THE CHART OF HEAD O0F TIME, i WAS LOOKING AT ANOTHER CHART WHILE TYPING THE IDEA..... It's not pretty but I hope you get the point.
SMT= Smart Money Theory, Please See the related Tutorial regarding smart money principles.
Tripple high, possibly breaks a little higher, make people think it a break out and then it slams on the breaks and heads back down towards the two large fair value gaps and a "Missed opportunity gaP" to possibly the bullish OB (Order Block) that will probably happen around Thursday or Friday (between 1145 and 1135. Before having the weekly profile complete its task of creating wicked on both sides and creating the high and the low at the beginning and ef the week. It still has broken structurer and with two fairt value gaps belowe this only seems the most logical
Additionally we should ALWAYS Look at the commitment of traders indicator it is subject to provide such records for the CFTC. Here you can see a massive drop from longs to more net shjorts, which tells me a short is coming this way... or those p [eople that really study thjis and trade it a lot are not to bright
Heres the daily with no indicators except where the imbakances are, which is about all you need to know about ETH right meow.
chart
ENTRSANCE - 1315-1318
SL - 1360
take Profit - 1217
TP2 1151
TP3 - 1130
I know I fluibbed bad on the last one but last week was news heavy and the fundamentals had a lot to do with it. This week, not so much, so the technical analysis should win this week.
GL GT
BodiesXWix -
COINBASE:ETHUSD
BITGET:ETHUSDT
MEXC:ETHUSDT.P
CME:ETH1!

US30 BUY TO SELL MODELPrices took a short term high, giving us a shift in market structure, looking for pullback into a bullish order block or imbalance for a potential long entry. We are going to look for a fill of the sell-side imbalance.

$BTC - 42390 then Bullish - Halfway Through Discount FVG - *SMT**SMT = Smart Money Theory = everything you think that is not retail related to trading. First, SMT does not believe that triangles, wedges, trendlines, channels, harmonics, etc. has any effect on how price reacts. I'm Sorry but you won't convince me that Bitcoin knows it has created a triangle and that it knows how to react from that? It does and will remembers price levels, that's it. The second is to recognize that the price is not random, it is set by an algorithm controlled by those that control the asset. The Third thing to remember is price will move toward attacking where there is Liquidity (Equal Highs, Equasl Lows, phantom Trendlines etc.) and Balance (Fair Value Gaps, Liquidity Voids.) That's the basics. The rest is very unique in the vocabulary you need to have and the concepts that wrap around these ideas.
In This Signal....
I believe the momentum for the bitcoin chart is moving from the slight pullback that it just had to a more bullish structure. I believe the entrance would be roughly halfway through the the last 15 min fair value gap near the bottom of the current low. It should fill the imbalance to at least half, if not it could fill it entirely and a possibility that it is pulls through down to the daily fair value gap between, 41578.33 and 41766.79. Currently, It has hit the bearish order block, waiting to see which price point will be the turning point. It's the end of the week, second week of April starts today. Which leads me to believe that the price will end the week on a bullish run. The 12% drop of total price which is only 80% of a fibonacci pullpack,
12% drop Chart
which is 100% completely normal. To place your fib in the right place, make sure that the low you're measuring from is the most recent low that has broken and closed above a swing high or equal highs. Not all waves that need a Fib will be placed at the very bottom of the wave. You will be disappointed everytime as that is not that way Smart Money views a discount price. So please see this example as to how to place your fibs correctly.
Price should retrace 61.8-88.6% to the discounted Smart Money Price. This one is roughly 80% retracement which is about 90% of all retracements. In this area there is the last 15 min fair value gap, the price should turn bullish hit the bearish order block pull down until 42390 area and then finallly start rising. At the end of the week. Where is it aiming for? In the 15 min chart there is a liquidity void where two candles do not touch. This is a dead giveaway that price will want to return to this area. The high of that void is 46376.09 on this chart. It could take a week to reach the objective, maybe two. But we're due for more bullich runs. Especially after doing 30-20-90 day lookbacks and forwards. We should hit a new high by June or July.

Nikkei 225 Index Rallied Rally on JPN225 after hitting Bullish OrderBlock.
Price aims to target buyside liquidity.

Bullish Order FlowThis weeks price action was phenomenal on EURUSD. We had a clear bullish run respecting the order flow of the move.
After each break of structure, price was mitigated back to the order block that caused the breakout.
Over and over like clockwork.
If you can understand and grasp concepts like this, you can trade and stack positions when we have clear trending weeks.


EURGBP H4 PROJECTIONReason:
1. Divergence
2. Retest from potential spring
3. Mitigated 5min bullish OB
4. Market currently at the respective support zone

GBPJPY 30min PROJECTIONReason:
1. Mitigated 30min OB
2. Mitigated Daily OB
3. Divergence
4. Break of Structure

GOLD PROJECTIONReason:
1. Break of Structure
2. Mitigated 30min bullish OB
Watch out other blue zones, the lower price moves the better risk rewards ratio we get.

GBPCHF H4 PROJECTIONSmall push towards upside then a big down move
Reason:
1. Break of Structure
2. Price reacted to 4H bullish OB

CADJPY H4 PROJECTIONReason:
1. Potential Liquidity grab
2. Divergence
3. Approaching to 4H bullish OB


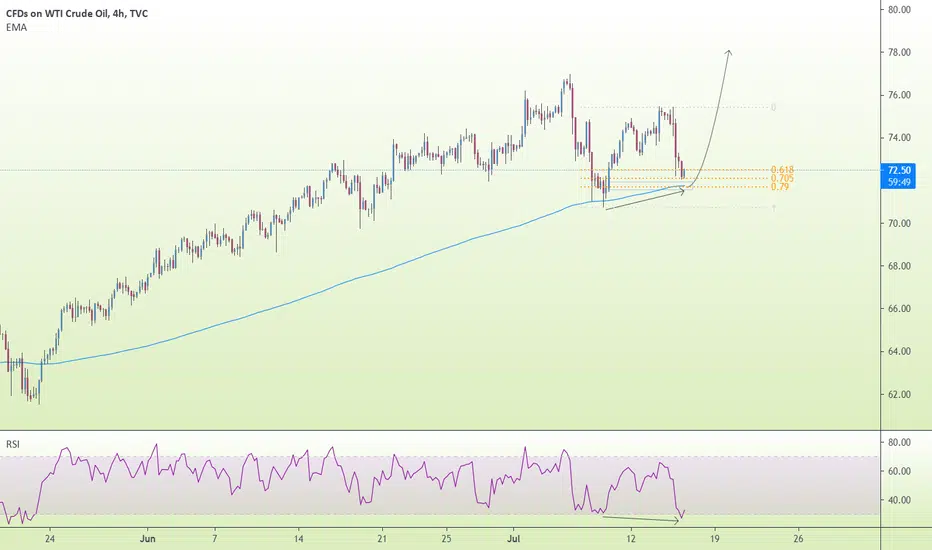
USOIL H4 PROJECTIONReason:
1. Expecting to be bounce on MA200
2. Approaching to 30min OB
3. Divergence
4. Price is currently in Discount Market