Market Update: Bullish Momentum and Key Buy Levels Near ATHHey Trader! 🚀📈
We're seeing some exciting action in the market right now! After the strong bullish bias following the GDP news, the market is clearly in an upward swing 💥. We've just witnessed the market break through the all-time high (ATH) and make a new ATH 🏆, but keep an eye on key levels for potential reversal points. 🔍
One crucial level to watch is 3080 – this could be a major turning point! Before making the higher high move, we saw the market retest the previous ATH level, and there's a significant order block near this zone, suggesting a strong buying opportunity. 📊💪
👉 BUY Setup:
- Watch for a bounce around the 3070–3080 area.
- This could be your entry for a potential rally to the upside 📈💰.
Remember, always follow proper risk management to protect your capital! 🛡️ Set your stop-losses and stay disciplined!
Happy trading, and let's catch those gains! 💸💥
Bullishpattern

TON Forms Inverse Head & Shoulders – Breakout Imminent?CRYPTOCAP:TON is forming a textbook Inverse Head & Shoulders pattern, a strong bullish reversal signal. The price is currently testing the neckline around the $3.90–$4.00 zone. A successful breakout and daily close above this level could confirm the pattern and trigger a move toward the $4.80–$5.20 resistance area.
Bullish Confirmation: Neckline breakout with volume.
Invalidation : close below 3.5
DYOR, NFA

XRP ANALYSIS🔮#XRP Analysis 💰💰
#XRP is trading in a symmetrical triangle in a weekly time frame and if it breakouts with high volume then we can see a bullish momentum in #XRP. Before that we will see little bit bearish movement towards its support zone and that a bullish movement.
🔖 Current Price: $2.3520
⏳ Target Price: $2.9740
⁉️ What to do?
- We can trade according to the chart and make some profits in #XRP. Keep your eyes on the chart, observe trading volume and stay accustom to market moves.💲💲
🏷Remember, the crypto market is dynamic in nature and changes rapidly, so always use stop loss and take proper knowledge before investments.
#XRP #Cryptocurrency #Pump #DYOR

AUD/CAD – Potential Bullish Reversal from Key Support📊 Chart Analysis
1️⃣ Accumulation Zone : The price previously traded within a rectangular consolidation range before breaking down.
2️⃣ Bullish Reversal Pattern : A falling wedge has formed, indicating a possible breakout to the upside.
3️⃣ Key Support : The price has tested the 0.8980 - 0.8970 zone multiple times and is showing signs of rejection.
4️⃣ Potential Upside : A breakout above 0.9030 - 0.9050 could confirm further bullish momentum.
🚀 Trading Plan:
📌 Entry : On a breakout above 0.9025
🎯 Targets :
First target : 0.9100
Extended target : 0.9130
🛑 Stop Loss : Below 0.8965 to minimize risk.
🔔 Confirmation Needed: Wait for strong bullish price action before entering long trades. 🚀🔥

Still Good to Go..as Mentioned in Yesterday's Video,
it Hit 430-435 range and closed around 420.
Stoploss for Now 398
It may hit 450 and then 460

Positive Monthly Closing is ImportantMonthly Closing above 191.10 will trigger more
positivity.
It may touch 200 - 210 initially.
Morning Star Formation Expected on Monthly tf,
and may target 215 - 216

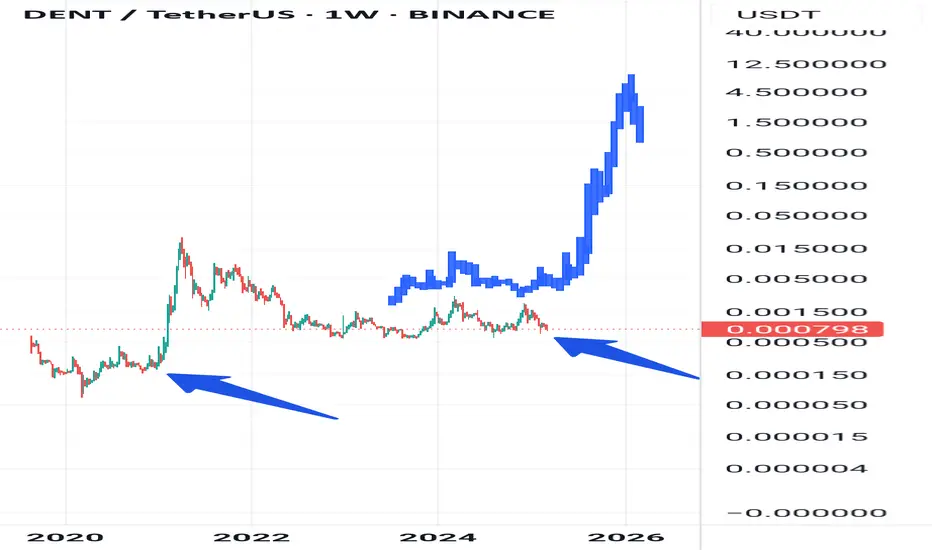
Is this pattern on Dent repeating?Look at the chart above. The bars pattern looks EXACTLY like the one from 2020/2021, but is a bit extended (which is in line with lengthening cycles).
Target: 0.08$ (which is about a 100x from here)
Stoploss: 0.0007$
Is this the one for you for altseason 2025?
Rustle
Ethereum (ETH/USD) Bullish Breakout – Eyes on $2,500+ Target 📈 Chart Overview:
Timeframe: 4H (Ethereum/USDT)
Trend Reversal: Ethereum has broken out of a falling wedge pattern, indicating a shift from bearish to bullish momentum.
Support Level: Around $1,800 - $1,900, where price previously found strong buying interest.
Retest Confirmation: ETH successfully retested the breakout level (~$2,020), confirming a potential bullish continuation.
Resistance Zone: The next key resistance area is around $2,250, followed by a potential move towards the $2,530 - $2,550 target zone.
📊 Trade Setup:
Bullish Bias: Price action suggests an upward move towards $2,250 and potentially $2,530.
Risk Management: A stop-loss can be set below $2,020 to minimize downside risk.
🔥 Conclusion: If Ethereum maintains momentum above the retest zone, it could see a strong rally in the coming days! 🚀

#BERAUSDT shows bullish momentum 📈 Long BYBIT:BERAUSDT.P from $8.080
🛡 Stop loss $7.905
🕒 1H Timeframe
⚡️ Overview:
➡️ The main POC (Point of Control) is at 6.699, indicating the area of highest volume accumulation.
➡️ The 7.905 level acts as the nearest support zone and is a key stop-loss reference point.
➡️ The chart BYBIT:BERAUSDT.P shows a strong bullish breakout with consolidation above previous range, signaling a possible trend continuation.
➡️ Rising volume confirms strength behind the move.
🎯 TP Targets:
💎 TP 1: $8.204
💎 TP 2: $8.320
💎 TP 3: $8.430
📢 Watch key levels closely — better to enter after signal confirmation!
📢 If the price holds above $8.080, the TP targets are likely to be hit.
📢 If stop level is breached, the setup may need reevaluation.
BYBIT:BERAUSDT.P shows bullish momentum — looking for further upside!

CAD JPY Trade Setup 1 hour timeframe CAD JPY Trade Setup 1 hour timeframe
Following last week's trade setup CAD JPY is moving in an uptrend making Higher Highs and Higher Lows, so we will keep looking for Buying opportunities.
CAD JPY is forming a bullish break and retest continuation pattern that also align with the 0.618-0.50 Fib Retracement level.
Lets wait for the price to pull back to the retest level then enter base off candlestick confirmation

ADAUSDTIn a bullish trend with no divergence or reversal pattern and a clear bullish flag continuation.

ETHUSD – Bullish Quasimodo + iH&S Breakout | Upside Targets!Ethereum (ETHUSD) has completed a textbook bullish Quasimodo pattern in confluence with an Inverse Head & Shoulders (iH&S) on the 15-minute timeframe. Price has broken out with strong bullish momentum, and the structure suggests more upside ahead.
📊 Technical Breakdown
1. Quasimodo Pattern
A well-defined Quasimodo reversal formed at the swing low, providing early signs of a bullish trend shift.
This pattern combines a higher low and reclaimed structure—offering an excellent base for trend continuation.
2. Inverse Head & Shoulders
Left Shoulder, Head, and Right Shoulder clearly structured with neckline breakout confirmed.
Breakout above neckline resulted in a 5.38% rally into minor resistance.
3. Bull Flag Formation
A short consolidation just below the recent highs resembles a bull flag, typically a continuation signal.
Breakout from the flag would trigger the next leg toward the final target.
🎯 Targets
Minimum Target: 2,121.41 — aligns with neckline projection.
Final Target: 2,229.90 — 6.27% projected move based on iH&S measured move.
📌 Trade Idea
Entry Zone: On bull flag breakout above 2,093
Stop Loss: Below 2,060 (flag low support)
TP1: 2,121
TP2: 2,229
🔎 Key Confluences
Pattern Breakouts ✅
Strong Momentum ✅
Clean Structure & Price Geometry ✅
ETH bulls have reclaimed short-term control. If momentum sustains, the upside targets are well within reach.

ETH/USD – Bullish Breakout & Buying OpportunityEthereum has broken out of a descending channel and is consolidating near a key support zone. The price action suggests a potential bullish continuation, with a buying opportunity forming above the $2,000 - $2,100 support level.
Key Levels to Watch:
Support: ~$2,000, ~$1,800
Resistance Zone: ~$2,250
Target: ~$2,530
Trading Plan:
Buy Entry: On breakout and retest above $2,250
Stop-Loss: Below $2,000
Take-Profit: $2,530
If Ethereum successfully breaks resistance with volume confirmation, it could rally toward $2,500+, making this a strong bullish setup. Keep an eye on price action for confirmation. 🚀

TAO ANALYSIS🔮 #TAO Analysis 💰💰
🌟🚀 As we can see that #TAO is trading in a symmetrical triangle and given a perfect breakout. But there is an instant resistance. If #TAO breaks the resistance 1 then we will see a good bullish move in few days . 🚀🚀
🔖 Current Price: $271
⏳ Target Price: $305
#TAO #Cryptocurrency #DYOR

Resistance Playing WellBearish Divergence on Daily & Weekly TF.
Now Strong Resistance is around 119500.
Cup & Handle Formation appearing at the Top.

BTC ANALYSIS#BTC Analysis : Channel Following
📊As we can see that #BTC is following ascending channel on daily time frame. Currently the price is trading above its major support zone. Price is moving upwards within a long-term rising channel, recently moving towards its support from its support level. Expect a bullish move in few days.📈
🔖 Current Price: $87,700
⏳ Target Price: $91,500
⁉️ What to do?
- Keep your eyes on the chart, observe trading volume and stay accustom to market moves.🚀💸
#BTC #MajorSupport #Cryptocurrency #ChartPattern #DYOR

BULLISH MOVEMENT AFTER 3000 LEVEL RETEST ALERT!Hello trader
today market is higher high mark and continue bull pattern and also make a trend line in m30
so we wait to break and test for change the trend wanna gold see 4 Time tap and go for BUY
and trend also bullish so going with bull bias
key level for target 3045 and 3060

META to $740 - Chance for Strong BounceNASDAQ:META Meta has hit the trend line from November 2022 after a price loss of 20% and has shown with a first small bounce that it is still relevant. At the same time, the SMA200 is also at the same point. Last but not least, the 0.238 Fib is also located in this area (from the entire upward movement from November 2022). Technically, we can therefore definitely expect a bounce that could take us to the previous ATH at $739.
Fundamentally, Meta is also not overvalued due to its strong growth. As with many of the Mag7s, there are still problems with the AI strategy, which does not appear to be well thought out in either monetary or structural terms. However, Meta is a good candidate for actual efficiency gains due to its affiliation with the advertising market. However, the general growth is already reason enough to buy.
Support Zones
$580.00
$541.00
Target Zones
$740.00

Bullish on Monthly TF but..Bullish on Monthly TF.
No Bearish Divergence on Monthly Tf.
But 40 - 40.20 is a Very Strong Resistance
that needs to Cross & Sustain with Good Volumes to
reach 45 - 46 & then 50+
We should not ignore that it has taken Support
from a Very Important Fib level around 32.40
Monthly Closing above 33.60 would be a Very Healthy sign.
So any dip towards 36.50 - 37.50 & then 34.50 - 35.50
can be a Buying Opportunity.
However, it should not break 31.80 otherwise we
may witness further Selling Pressure towards 28.50 - 28.70

Bitcoin Breakout: Potential Rally Towards $110K!"Key Observations:
Descending Channel: The price has been moving downward within a channel, showing lower highs and lower lows.
Support Level: Marked near $79,912.83, where the price recently bounced.
Breakout Scenario: BTC appears to be breaking out of the channel, suggesting a potential bullish trend.
Target: The projected target is $110,146.67, indicating a significant upward move.
Stop Loss: Positioned below the support level to manage risk in case of a price reversal.
Trading Idea:
A long trade setup is suggested, with entry upon confirmation of the breakout.
Stop-loss below the recent low ($79,912.83) to minimize risk.
Profit target near $110,146.67, aligning with previous resistance levels.
This setup follows a classic breakout and retest strategy, expecting bullish momentum if Bitcoin sustains above the resistance zone.

#VICUSDT shows signs of reversal and strength📉 LONG BYBIT:VICUSDT.P from $0.2507
🛡 Stop loss $0.2470
🕒 1H Timeframe
📍 Important Note:
Wait for confirmation around the $0.2507 level. Enter the trade only if price holds above with volume.
✅ Overview BYBIT:VICUSDT.P :
➡️ The chart shows a completed Falling Wedge — a bullish reversal pattern that typically leads to an upside breakout.
➡️ After that, a Bearish Pennant formed but failed to push the price significantly lower, indicating weakness in sellers.
➡️ Currently, the price is breaking out of the triangle pattern, hinting at a possible bullish continuation.
➡️ Entry level marked at $0.2507, right after the breakout zone, supported by steady volume and short-term uptrend.
➡️ Volume Profile on the left reveals a low-volume zone above, making it easier for price to climb toward TP targets.
🎯 TP Targets:
💎 TP 1: $0.2525
💎 TP 2: $0.2545
💎 TP 3: $0.2565
⚡ Plan:
➡️ Monitor price reaction at TP1 — partial exit recommended.
➡️ Watch for confirmation above $0.2507.
➡️ Enter LONG after retest and volume confirmation.
➡️ Set stop loss below recent low — at $0.2470.
🚀 BYBIT:VICUSDT.P shows signs of reversal and strength — holding above the breakout zone could lead to upside movement!

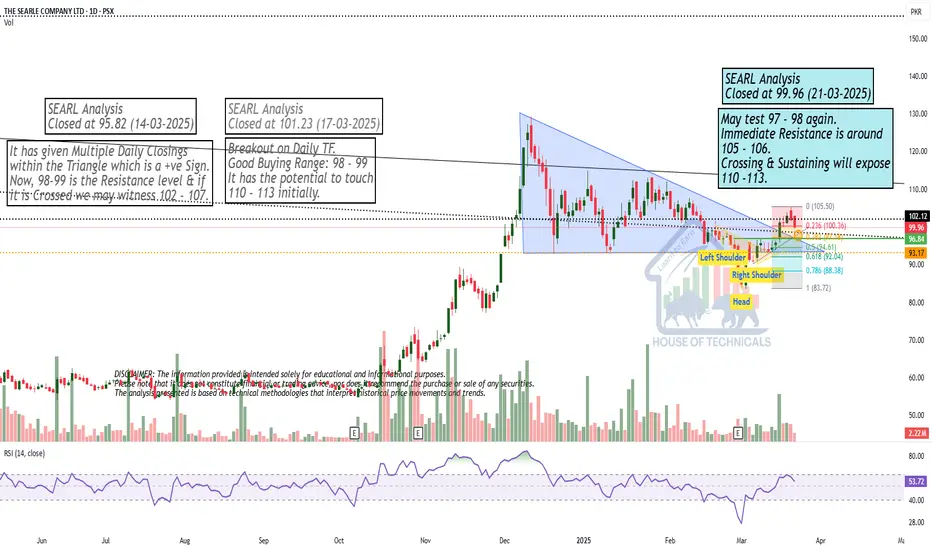
May test 97 - 98 again.May test 97 - 98 again.
Immediate Resistance is around
105 - 106.
Crossing & Sustaining will expose
110 -113.
Bullish on Bigger Time Frames.Bullish on Bigger Time Frames.
Immediate Resistance is around 126 - 127.
Potential to touch 200 is 127 is Sustain on
Monthly Basis.
On the flip side, 101 - 111 is the Support level
(if it takes pressure now.
Now it should not Break 89.
