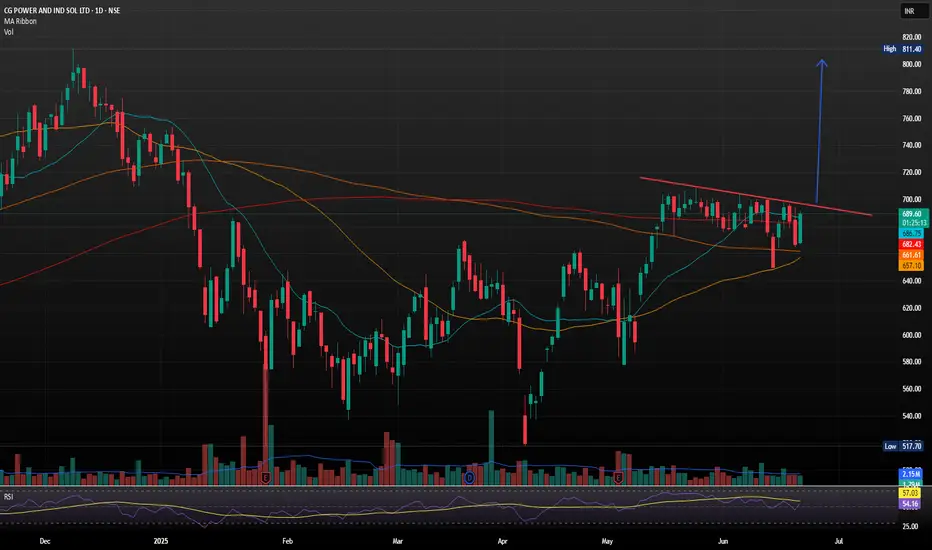
CG Power and Industrial Solutions with Strong Bullish Flag SetupCG Power and Industrial Solutions just landed its largest-ever single order a 641 crore contract from Power Grid Corporation of India Ltd (PGCIL) for high-voltage transformers and reactors
The company, now under the Murugappa Group, reported consolidated FY25 revenues of 9,909 crore. However, annual profit dipped to 972.98 crore from 1,427.61 crore in FY24, despite a strong Q4 showing with a 17% YoY rise in net profit to 274.26 crore.
- Inverse Head & Shoulders Breakout: The stock recently broke out of an inverse H&S pattern, a classic bullish reversal signal, with strong volume confirmation. Holding above 690 could push it toward 750 TO 800.
Support & Resistance Levels
- Support: 663–679 demand zone
- Resistance: 694, 704 and 712
Trend Summary
- Short-Term: Neutral to bullish
- Medium-Term: Bullish bias if it sustains above 690
- Volatility: Elevated, so expect sharp swings
Bullishpattern
Sklz is about tonser 7$Coiling up buying momentum rising, all this needs is a volume spike.
200 shares 7.48$ and 200 shares in .10+ increments till 8$ this is a STRONG buy based on rsi macd
15min 1hr 4hr 1 day COILED for bull run

$VET USD 1HR INCOMING PUMP?Structure & Zones
Price is trading between a clear supply zone above and a demand zone below, offering defined areas for reaction.
Two unfilled FVGs on the 1D timeframe above current price could act as magnet zones for price continuation.
A 4H FVG just beneath current price is nearly filled — potential area for a bullish bounce.
Three psychological price levels are marked and align with Fibonacci and FVG targets, likely to act as resistance zones if price pushes higher.
Trend & Pattern
High timeframe (HTF) remains bullish, supported by the formation of a rounding bottom — a strong reversal structure suggesting accumulation.
Lower timeframe (LTF) is showing short-term bearishness as price pulls back and retests key support/trendline.
Price is holding above a bullish trendline, maintaining structure unless a breakdown occurs.
Volume & Momentum
The OBV indicator shows a broken rising wedge, signaling a possible momentum slowdown or short-term correction.
Anchored volume profile reveals high volume beneath price — indicating that previous trading activity supports current levels and adds bullish confluence.
Outlook & Trade Consideration
Bias remains bullish overall, supported by HTF structure and unfilled FVG targets above.
A potential pullback into the 0.5–0.618 fib retracement zone or into the 4H FVG could present long entry opportunities.
On continuation, price may target the daily FVGs and psychological levels as resistance or take-profit zones.
Watch for a rejection at fib/psych levels or breakdown below the bullish trendline to reassess bias.

ETH | BULLISH Pattern | $3K NEXT ??Ethereum has established a clear bullish pattern in the daily as we're seeing an inverse H&S:
The war issues across the globe must also be considered. So far, it's been bullish for crypto but this can also change overnight since it's a very volatile situation - and crypto being a very volatile asset.
For the near term, I believe ETH is due for another increase - at least beyond the current shoulder. This is IF we hold the current support zone:
It seems to be a bit of a slow burn with ETH for this season's ATH. In the ideal world, we'd either:
📢 consolidate under resistance (bullish)
📢make a flag (bullish)
📢OR smash right through the resistance.
But there's likely going to be heavy selling pressure around that zone.
__________________________
BINANCE:ETHUSDT

$banana PARALLEL CHANNEL ON BANANA GUN$banana parallel channel on banana gun.
Have we bottomed?
Do we now go to the top of the parallel channel?
I think we go there in june.
Q3 aka july, aug, sep going to be consolidation
Q4 we begin the bull run.

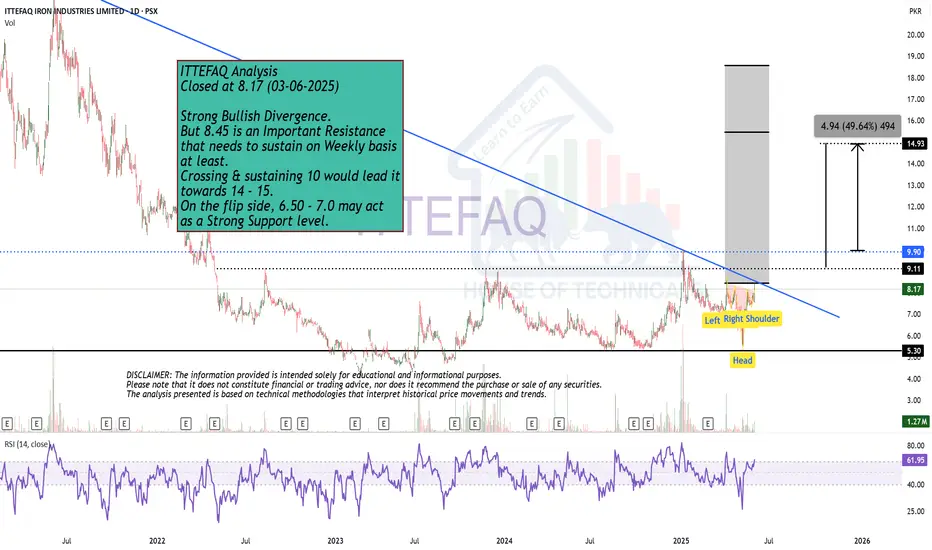
Strong Bullish Divergence. Closed at 8.17 (03-06-2025)
Strong Bullish Divergence.
But 8.45 is an Important Resistance
that needs to sustain on Weekly basis
at least.
Crossing & sustaining 10 would lead it
towards 14 - 15.
On the flip side, 6.50 - 7.0 may act
as a Strong Support level.
Strong Bullish Divergence on Bigger tf.FECTC Closed at 76.81 (16-06-2025)
Strong Bullish Divergence on Bigger tf.
Hidden Bullish Divergence also appearing.
Taken Support from 0.618 fib level.
Cup & Handle Formation on Bigger tf.
Upside Resistance is around 126 - 133
Crossing & Sustaining this level may lead it
towards 220 - 240.
However, it should not break 55 now.

PIPPIN/USDT Long Setup Update!!PIPPIN Breakout Alert – 100% Potential on the Table
Hey Traders — if you're into high-conviction setups with real momentum, this one’s for you.
PIPPIN is breaking out from a falling wedge pattern on the 4H timeframe after a long period of consolidation. This structure typically signals a potential reversal with strong upside momentum.
With the recent breakout, we’re looking at a fresh long opportunity:
Entry:
Current levels: 0.0172 and add more up to $0.0155
Stop-Loss:
Below support: 0.0141
Targets:
Target 1: 0.0336
Target 2: 0.0450
Target 3: 0.0550
Target 4: 0.0650
✅ Risk-reward remains highly favorable from this point.
✅ Tight stop-loss to manage risk in case of any invalidation.
✅ Watch for confirmation above immediate resistance for further strength.
Disclaimer: Always manage your position size and risk. Trade safe!

Extremely Bullish.Closed at 281.50 (05-06-2025)
Extremely Bullish.
But 289 - 290 is an Important Resistance.
Needs to cross & sustain 295 - 308 Zone for
further upside.
as mentioned in yesterday's video, 277 - 279
may act as Support.
Breaking 272 will bring more selling pressure.

Beautiful ABCD pattern appearing on bigger tf.Beautiful ABCD pattern appearing on
bigger tf.
Crossing 101 - 102 with Good Volumes may
trigger new highs towards 120 atleast.
78 - 80 is an Immediate Resistance area.
On the flip side, a Very Strong Support is
around 68 - 70 & then around 62 - 63

MY BEST TRADE - CRCLCRCL. A beautiful retest on liquidity zone. The stock retraced to exact marked levels and grabbed all the liquidity two times near 102 to 104.
UP 31% till now.

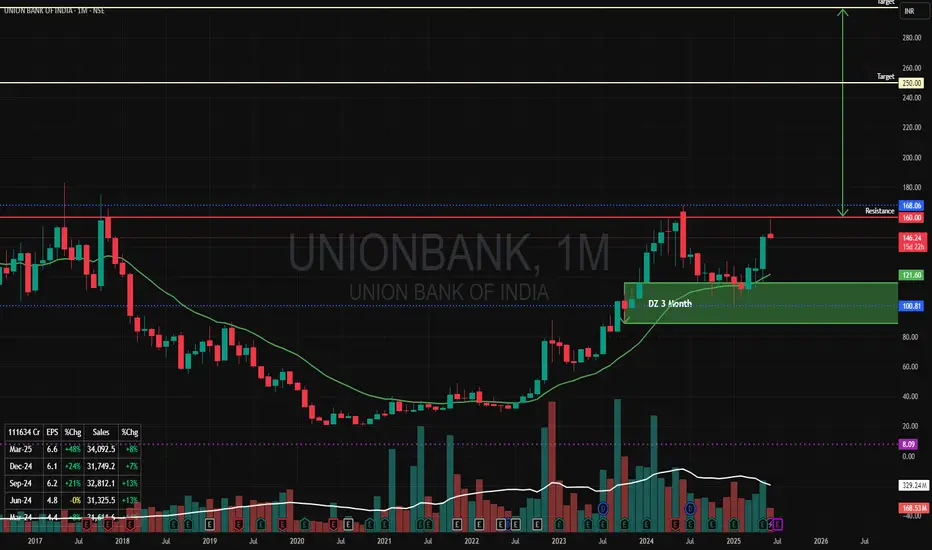
"Union Bank of India" Cup & Handle PatternI can see a Cup & Handle Pattern in Union Bank of India in Monthly Time Frame. Price is also coming from Monthly Demand Zone.
Rs 160 is a a Resistance line to break this Pattern.
Once we see a breakout of this level of Rs 160 Upside with a Good Volume (Increased from Previous Months) the Price can double from here to Rs 300 in next 12 months time.
first Target Rs 250/-
Second Target RS 300/-
Lets Hope for the Best!
ETH ANALYSIS📊 #ETH Analysis : Update
✅As we said earlier, #ETH performed same. Now we can see that #ETH is trading in a bullish flag pattern and its a bullish pattern. We could expect around 10% bullish move if it sustain above its major support.
👀Current Price: $2555
🚀 Target Price: $2815
⚡️What to do ?
👀Keep an eye on #ETH price action and volume. We can trade according to the chart and make some profits⚡️⚡️
#ETH #Cryptocurrency #TechnicalAnalysis #DYOR

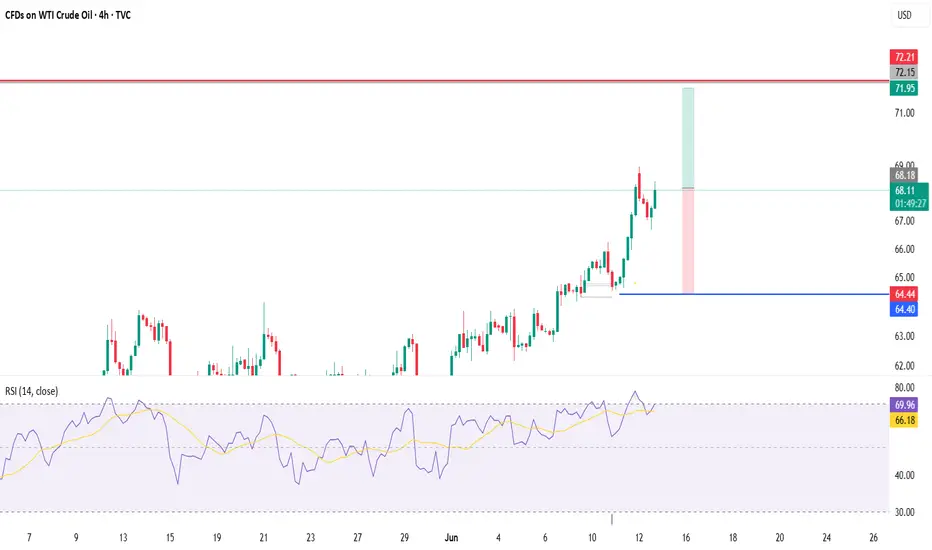
US OIL 🛢️ USOIL Trade Plan – Based on Dow Theory (4H TF)
📌 Bias: Buy / Long
Dow Theory shows Higher Highs (HH) and Higher Lows (HL) structure on the 4H — indicating an uptrend
SL TP marked in Chart / Entry Instant or buy near CMP
OKLO Daily Cup and HandleStrong pattern formed off a key level that could breakout in August or September. Upper price target of 90 as long as the gap is filled but not too far under

BUY POSITIONToday im looking at buy positions to the highlighted target continue to make higher highs

Ethereum (ETH/USDT) – Ascending Triangle Breakout Incoming?ETH is pressing against the upper resistance of a long-forming ascending triangle on the 4H chart — historically a bullish continuation pattern.
Previous Move:
Last breakout saw a +49.7% move, and the structure suggests we could see a similar surge again!
Key Levels:
Support: $2,242.98
Breakout Zone: $2,850
Resistance/Target 1: $3,419
Major Target 2: $4,282 (+49.7%)
RSI: 70.5 — strong momentum, near overbought but in breakout territory.
Volume seems to be increasing near resistance, a breakout could be imminent.
Potential Upside: +49.7% if triangle breaks cleanly.
Bias: Bullish
Timeframe: 4H
Watch for: Rejection at $2,850 or breakout retest for entry confirmation.
This is not financial advice, please do your research before investing, as we are not responsible for any of your losses or profits.
Please like, share, and comment on this idea if you liked it.
#ETH #Ethereum #ETHUSDT

AMZN: Watch for a Break Above 218.00If NASDAQ:AMZN manages to push above 217.85 , there's a strong chance we’ll see a move toward 219.96 . However, caution is advised around the 218.00 level – both premarket and postmarket sessions showed hesitation and failed to hold above that resistance.
A more conservative approach would be to wait for a clean break above 218.00 before entering.
🔍 Context:
We’re currently in a solid uptrend. On the daily chart, we’ve seen a rejection of the downside, marked by an inside bullish candle with a notable wick – suggesting upward pressure that the market may try to release. Given recent premarket activity, the 218.00 area remains a key battleground for bulls and bears alike.

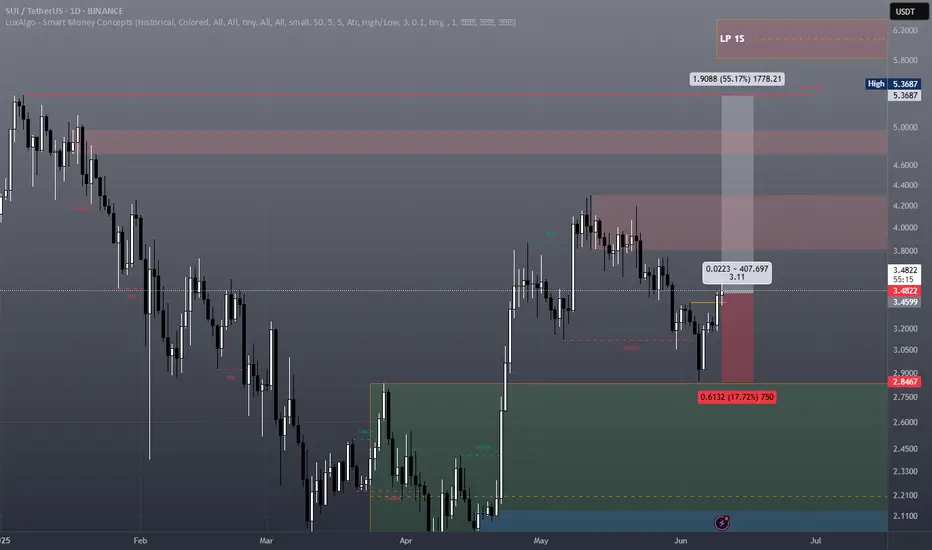
SUI is building momentum!📈 CRYPTO:SUIUSD After a three-swing corrective pullback into the $3.3 - $2.7 buying zone, price is bouncing and setting up for the next upside move.
The structure is in place—let’s see if the breakout confirms!

KAJARIA CERAMICS - Bullish Flag & Pole Breakout (Daily T/F)Trade Setup
📌 Stock: KAJARIA CERAMICS( NSE:KAJARIACER )
📌 Trend: Strong Bullish Momentum
📌 Risk-Reward Ratio: 1:3 (Favorable)
🎯 Entry Zone: ₹1065.00 (Breakout Confirmation)
🛑 Stop Loss: ₹965.00 (Daily Closing Basis) (-9 % Risk)
🎯 Target Levels:
₹1103.40
₹1143.15
₹1184.35
₹1227.05
₹1271.25
₹1317.10
₹1359.50 (Final Target)
Technical Rationale
✅ Bullish Flag & Pole Breakout - Classic bullish pattern confirming uptrend continuation
✅ Strong Momentum - Daily, Weekly RSI >60 (Bullish zone)
✅ Volume Confirmation - Breakout volume 608.73K vs previous day's 302.91K (Nearly 2x surge)
✅ Multi-Timeframe Alignment - Daily and weekly charts showing strength
Key Observations
• The breakout comes with significantly higher volume, validating strength
• Well-defined pattern with clear price & volume breakout
• Conservative stop loss at recent swing low
Trade Management Strategy
• Consider partial profit booking at each target level
• Move stop loss to breakeven after Target 1 is achieved
• Trail stop loss to protect profits as price progresses
Disclaimer ⚠️
This analysis is strictly for educational purposes and should not be construed as financial advice. Trading in equities involves substantial risk of capital loss. Past performance is not indicative of future results. Always conduct your own research, consider your risk appetite, and consult a financial advisor before making any investment decisions. The author assumes no responsibility for any trading outcomes based on this information.
What do you think? Are you watching NSE:KAJARIACER for this breakout opportunity? Share your views in the comments!

ENGINEERS INDIA LTD - Bullish Flag & Pole Breakout (Daily T/F)Trade Setup
📌 Stock: ENGINEERS INDIA LTD ( NSE:ENGINERSIN )
📌 Trend: Strong Bullish Momentum
📌 Risk-Reward Ratio: 1:3 (Favorable)
🎯 Entry Zone: ₹242.00 (Breakout Confirmation)
🛑 Stop Loss: ₹211.00 (Daily Closing Basis) (-12.6 % Risk)
🎯 Target Levels:
₹253.95
₹266.50
₹279.50
₹293.45
₹307.90
₹327.00 (Final Target)
Technical Rationale
✅ Bullish Flag & Pole Breakout - Classic bullish pattern confirming uptrend continuation
✅ Strong Momentum - Daily, Weekly & Monthly RSI >60 (Bullish zone)
✅ Volume Confirmation - Breakout volume 20.96M vs previous day's 3.64M (Nearly 7x surge)
✅ Multi-Timeframe Alignment - Daily and weekly charts showing strength
Key Observations
• The breakout comes with significantly higher volume, validating strength
• Well-defined pattern with clear price & volume breakout
• Conservative stop loss at recent swing low
Trade Management Strategy
• Consider partial profit booking at each target level
• Move stop loss to breakeven after Target 1 is achieved
• Trail stop loss to protect profits as price progresses
Disclaimer ⚠️
This analysis is strictly for educational purposes and should not be construed as financial advice. Trading in equities involves substantial risk of capital loss. Past performance is not indicative of future results. Always conduct your own research, consider your risk appetite, and consult a financial advisor before making any investment decisions. The author assumes no responsibility for any trading outcomes based on this information.
What do you think? Are you watching NSE:ENGINERSIN for this breakout opportunity? Share your views in the comments!

SUI - SWING TRADESUI – Swing towards the ATH and aiming to create a new one, reacting within a weekly Liquidity Pool between 5.83 and 6.35.
LFG!
FLOKI Correction Complete & Ready to Rally!📊 CRYPTO:FLOKIUSD found strong buying interest in the blue box area at $0.000083 - $0.000074, setting the stage for a trend continuation to the upside.
🚀 Will momentum push it toward new highs?
