AXS bull pennantVolume decreasing, broke out from previous resistance level, bull pennant - a continuation pattern , could explode. Use stop loss
Bullish Pennant

PolkaDot DOTUSDT - HUGE Secret Parallel Channel on the Daily!- Polkadot is very strong on the daily timeframe, as we can see.
- The price broke out of the bullish falling wedge and now is unstoppable!
- On the largest time scale, we can spot a huge blue parallel channel, which acts like a support and resistance.
- For expected duration of the trade, probability, stop loss, profit target, entry price and risk to reward ratio (RRR) - please check my signature below ↓
- Due to my Elliott wave count, the correction is totally over and we can expect a higher prices!
- If you want to see more of these ideas, hit "Like" & "Follow"!

Ethereum Classic ETC - MASSIVE parallel channel + TRIANGLE!- We have a huge parallel ascending channel on the daily chart, which provide us with great support/resistance!
- Bullish volume is much higher, than bearish volume!
- Ascending triangle is also very bullish!
- The price is above 200 daily moving average.
- For expected duration of the trade, probability, stop loss, profit target, entry price and risk to reward ratio (RRR) - please check my signature below ↓
- If you want to see more of these ideas, hit "Like" & "Follow"!

Cardano ADAUSD - Road to 10 USD! Elliott Wave + Rounding Bottom!- Cardano is currently breaking out of the symmetrical triangle!
- Symmetrical triangle - The price is creating higher lows and lower highs.
- Also, the price is above the ALL TIME HIGH level, which is very bullish.
- We will experience an acceleration to the upside in a few days!
- Cardano made a huge rounding bottom or cup and handle on the weekly time frame.
- For expected duration of the trade, probability, stop loss, profit target, entry price and risk to reward ratio (RRR) - please check my signature below ↓
- Due to my Elliott wave count, we are currently at the 5th impulse elliott wave!
- If you want to see more of these ideas, hit "Like" & "Follow"!

Doge DOGEUSD - Bull Flag is breaking out! New ATH soon!- Doge is currently breaking out of the bull flag / wedge as we can see on the chart.
- For expected duration of the trade, probability, stop loss, profit target, entry price and risk to reward ratio (RRR) - please check my signature below ↓
- 200 daily moving average & 0.236 fib act as a SUPPORT in this case.
- However the price broke down of the ascending channel, which is sign of weakness.
- If you want to see more of these ideas, hit "Like" & "Follow"!

DEEPAK FERTILISERS - Bull Pennant Breakout - Swing TradeThe above analysis is done purely on basis of Price Action & Chart Patterns.
The analysis is done on daily TF hence price may take few days to few weeks in order to reach the targets.
The stock is backed by good fundamentals. Upmove has been well supported by Volume.
Entry and SL is explained in image itself. Target as per pattern is also shown in the image itself.
To get an overall view of the stock movement, check the below image as well.
[ b]The above analysis is purely for educational purpose. Traders must do their own study before entering into any trade. Traders must trade as per their own risk taking capacity and money management.
Feel Free to comment for any query or suggestion regarding this stock or Price Action Analysis.
Checkout my other ideas to understand how one can earn from stock markets with simple trade setups.

Silver to gain 50% by end of September? Bullish pennant Potential bullish pennant for silver (Have been watching for 3 months now)
I think this is the last higher low before we send it to $37 by the end of September for a 50% gain
Using a Gann Fan it would seem the pole, target, and time line up for mid September

Ethereum ETHUSD - Road to 10 000 USD! + HUGE Ascending channel!- Ethereum looks very strong from the technical perspective.
- The price is above the ALL TIME HIGH from 2018, which is very bullish of course.
- For expected duration of the trade, probability, stop loss, profit target, entry price and risk to reward ratio (RRR) - please check my signature below ↓
- Also the price is above 0.236 fib, 20 weekly moving average and the blue ascending channel!
- RSI is ready for the another pump to the upside very soon.
- If you want to see more of these ideas, hit "Like" & "Follow"!

EURUSD 4H Analysis August 2nd1H & 4H bullish pennant. 4H BB squeeze indicating impulse breakout. Start of swing trade move to upside. View related ideas link to see higher time frame analysis.

DFI.Money YFIIUSDT - Rectangle Bottom Formation- On the daily chart we can see a rectangle formation, which usually leads to explosive moves!
- For expected duration of the trade, probability, stop loss, profit target, entry price and risk to reward ratio (RRR) - please check my signature below ↓
- Target 1 is 0.618 FIB and target 2 is below all time highs, but I beliave the price will be much higher than that.
- Check my related idea about DFI.MONEY vs BTC in the related section!
- YFII is really ready to pump very soon!
- If you want to see more of these ideas, hit "Like" & "Follow"!

BitTorrent BTTUSDT - Bull Flag + 1000% gains!- BitTorrent is the most popular torrent client (together with uTorrent).
- On the chart we can see a bullish flag, which is currently breaking out!
- For expected duration of the trade, probability, stop loss, profit target, entry price and risk to reward ratio (RRR) - please check my signature below ↓
- The price retested the ALL TIME HIGH level, we can clearly see a sign of interest at this point.
- 1000% gains is possible in next months, so be prepared!
- If you want to see more of these ideas, hit "Like" & "Follow"!

***Potential $43000 BTC IN PLAY***Good day fellow traders! BTCUSD is forming what looks like to be a Bullish Pennant. The price target for this pattern would be $43k if it plays out. There's some resistance at $39.1k and support at $37.6k. This would be about a 12% move to the upside. (Short-Term) trade opportunity. :)
Disclaimer: I'm NOT a financial adviser...just a regular "joe" voicing my opinion :)
Peace Love Money ;)

GBPJPY Weekly Pennant July 23Price still in major uptrend. Smaller time frames creating bullish pennant on weekly for breakout and strong continuation.

Theta in BULL pennant... don't miss this oneTHETA formed a nice bull pennant, continuation pattern that signals this could have more upside in near future... Set alarms for this one and don't miss it... BTC sudden dump could ruin this...

Bullish SeptemberThere's a very clear bull pennant near completion for XAG.
The flagpole started at 12.134 (lower wick) and goes up to 29.592 (upper wick). More conservatively, the pole would be slightly shorter, but this range is what I view as the maximum potential move after the completion of the pattern, a somewhat drastic movement of 17.458.
According to the range of the flagpole added to the price at completion in the area of about 26.115, it indicates a potential move to as high as 43.573 in this run up.
The timing of this pattern seems to coincide with the completion of the ascending wedge of SPY and ES1! that's been steadily becoming concrete since March 2020. That ascending wedge seems to be headed for its terminus at just around the same time, if not a bit before. This makes some sense as silver prices tend to be reactive rather than predictive, so we can expect that silver's run-up (if it happens) will take place after any market correction.

EUR/USD multi time frame analysis- Head and ShouldersPurple Line = Weekly trendline
Red Lines/Zones = Daily SNR/Trendline
Orange Lines/Zones = 4 Hour SNR/Trendlines
EUR/USD is now on Uptrend because price break Weekly Descending Trendline which is started since 07/07/2008 and break up on 28/07/2020 and from that point EUR/USD is in uptrend.
On Daily chart we can see that there is something like Bullish Pennant chart pattern formed.
When we scroll down to 4 hour chart we can see that now formed Falling wedge chart pattern and than happen breakout, then again formed new Falling Wedge Chart Pattern and now price go near neckline of Head and Shoulders Candlestick Pattern.
After previous Falling Wedge we can see clear breakout and because market repeat itself now we can expect again breakout of this Head and Shoulders Candlestick Pattern
it doesn't matter because it's uptrend, price doesn't have the strength to go immediately up because there's plenty of resistance zones + formed this candlestick patterns and chart patterns which showing downtrend Momentum. My opinion is when see bearish candle on 4 Hour chart which close bellow neckline of Head and Shoulders candlestick pattern then should start downtrend till Weekly Support Level or above Weekly support level and then will uptrend start again
If this help you with your trading Please Like, Share and Follow that give me motivation to make another Trading Ideas
If you have some suggestion, comment or other opinion feel free to write it in comment
Wish you succesfull and consistent trading with profits!
This is not an investment advice.
"CFDs are complex instruments and come with a high risk of losing money rapidly due to leverage. Between 74-89% of retail investor accounts lose money when trading CFDs. You should consider whether you understand how CFDs work and whether you can afford to take the high risk of losing your money."

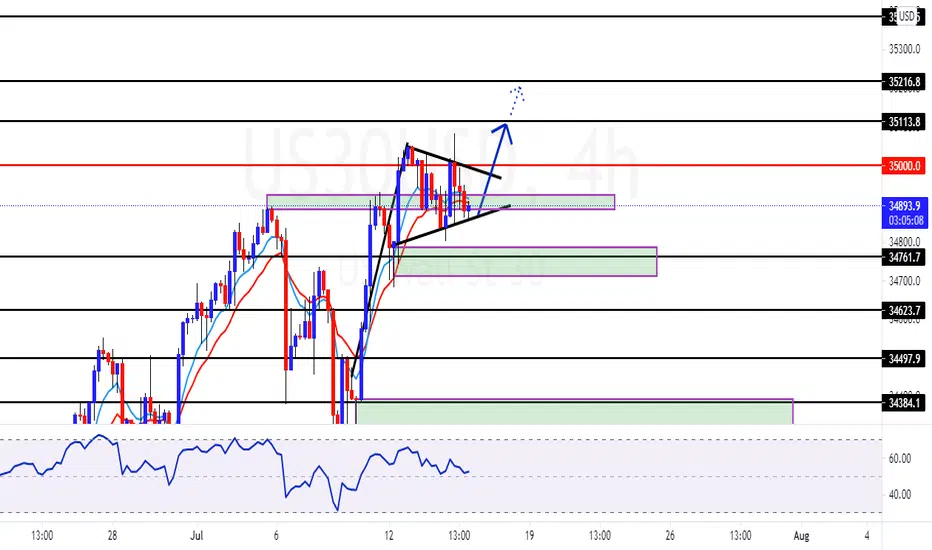
US30 July 14th AnalysisWaiting to see if price holds bullish pattern. May break 35000 before doing a pullback.
MUTHOOTFIN - Ready for another leg of rally? - Swing TradeThe above analysis is done purely on basis of Price Action & Chart Patterns.
The analysis is done on daily TF hence price may take few days to few weeks in order to reach the targets.
For understanding how to trade a Bullish Pennant Structure, refer to the ideas linked below.
The above analysis is purely for educational purpose. Traders must do their own study before entering into any trade. Traders must trade as per their own risk taking capacity and money management.
Feel Free to comment or message me for any query or suggestion regarding this stock or Price Action Analysis.
Checkout my other ideas to understand how one can earn from stock markets with simple trade setups.

GBPJPY Daily Pennant July 1stBullish Pennant/triangle on Daily. In confluence with weekly fib (related link idea). Anticipating Huge breakout for fast impulse move. Swing Trade setup.

WABAG - Retest+Reversal, Ascending Channel, Bull Pennant - SwingThe above analysis is done purely on basis of Price Action & Chart Patterns.
The analysis is done on daily TF hence price may take few days to few weeks in order to reach the targets.
Trade setup is explained in image itself.
SL can be kept either below 335 (for risk taking traders) and below 306 (for safe traders)
The above analysis is purely for educational purpose. Traders must do their own study before entering into any trade. Traders must trade as per their own risk taking capacity and money management.
Feel Free to comment or message me for any query or suggestion regarding this stock or Price Action Analysis.
Checkout my other ideas to understand how one can earn from stock markets with simple trade setups.

AMC's Bullish Pennant Breakout ScenarioAMC has been consolidating for more than 3 weeks now.. we've found major support at the $50 level and continue to ride the waves. It is only a matter of time before this pennant breaks out. This isn't over just yet, we are priming up for something big very very soon.. and it always happen when we least expect it.

Wyckoff Accumulation Phase for BTCBTC has been trading sideways and it found a bottom after a huge drop from 59500-ish. Then it was bouncing between two major support level 42K and 31K and started to form the famous Wyckoff Accumulation Phase, recently on the 22nd of June we formed a Spring , and now we are in the Test ing phase if the test succeeds we should slowly but steady start to march toward the upside and after LPS (Last Point of Support) at 35K, and then if we go above 42K it's a SOS (Sign Of Strength) and if we make solid support there we should be ready to continue to the uptrend.
Resource:
medium.com

AMC Bullish Pennant Still Holding - Monday 4/5ths BreakoutThe damages are done, we are just playing the waiting game. The longer they drag this on the higher our chances of a margin call go, due to the increasing risk liability.
Low volume before the storm. Apes holding the float and price at $40.
