Bullish Pennant, Symmetrical Triangle or Descending Triangle.New 2019 ATH's are one Donald Trump Tweet away
IN other words, trade wars lead to currency wars lead to real wars!
Time will tell per usual.
Bullish Pennant


New Bitcoin Rally, Possible 50% ProfitBitcoin is making a bullish pennant with a possible profit of 50%,
Take profit 1 $11,500
Take profit 2 $14,500
Stop Loss $9,350

ETH/BTC -> Potential Entry on Bull Pennant (Novice Analysis)If we can 1H close above the blue line, this
could be a good play for ETH/BTC.
Bull Pennant printed out and price is looking
to retest the top as support to signal an entry.
Potential targets are the orange lines acting
as short term resistance.
If invalidated, we'd be looking to test the S/R
flip located at the black line.

$BTC in Bullish Pennant: Target $14.5k and beyond in August 2019Hi everyone,
Welcome to another update on Bitcoin!
Check out that long term 2019 trend line. We think it will hold as very strong support for this ABC correction, which is nearing its end.
Bitcoin is coiling in a Bullish pennant for more than a month now, with some over-extended price action.
So how is this bullish pennant (green triangle on chart) formed?
The support (lower side of the triangle) is the long term 2019 trend line (yellow).
The right side of the triangle is the neckline of the infamous inverse head and shoulders in July.
The left side is the upwards rise connecting the above 2 sides.
That's your bullish pennant!
Expecting breakout of pennant anytime in the coming 2-3 weeks as the price action coils towards the tip of the triangle, and as the C wave finishes correcting probably down to $8.8k levels (which happens to have a nice fibonacci confluence with the retracement from Jan 2019).
In Summary: we're expecting $8.8k soon, then a continuation of the rally to $14.5k targets (and beyond) in August 2019.
P.S. It's not worth taking the risk to wait to $8.8k levels to buy the dip - doing so now is more guaranteed. In fact, there is a possibility that the C wave is already in, and Bitcoin is en route to 5-digits with no turning back to 4-digits again!
Cheers,
Leb Crypto

Bitcoin and Gold Look Very SimilarBitcoin and Gold seem to have a correlating pattern right now, they have both formed a Bullish Pennant. A break out of this pattern will signify more upside for both. It is going to be very interesting to see how this plays out!

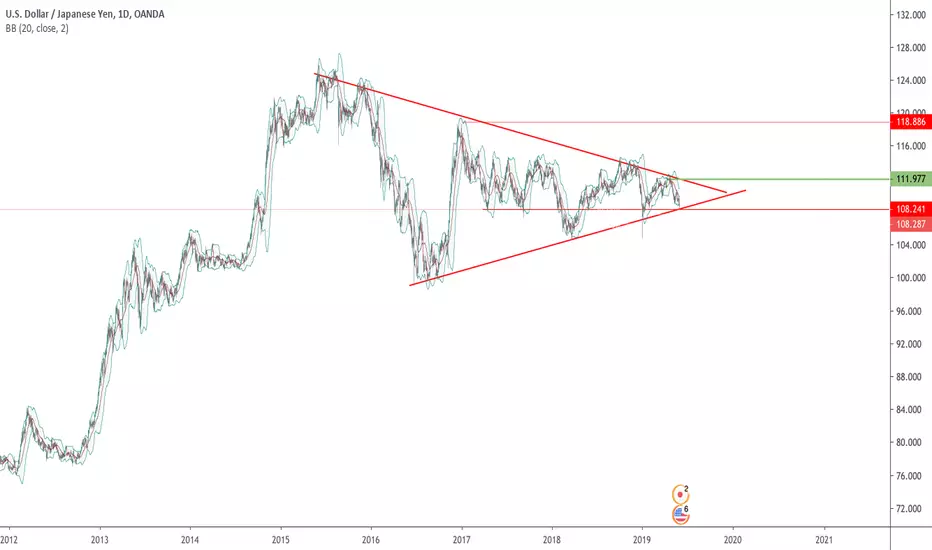
Is this a long term BULLISH Pennant - Potential BUY USDJPY has potentially formed a long term bullish pennant.
Trump has caused havoc yesterday whilst tweeting about Mexican trade tariffs.
Everything has dropped again the JPY. Could we see some relief next week?
If this is a bullish pennant, we could see the USDJPY rise above 112 in the long term.
Any thoughts or ideas welcome...
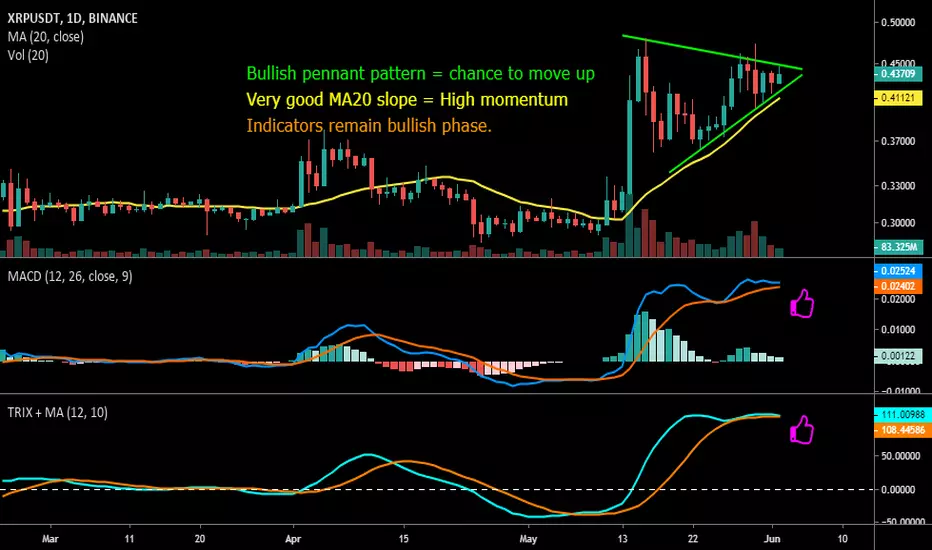
XRP the only one shows bullish in top coins.BITSTAMP:XRPUSD
While BTC, ETH and BNB all show bearish favor or turned to bearish mode, XRP holds bullish phase and keeps good volume day by days.
Since the earlier of 2019, XRP usually goes against BTC move, will XRP do the same thing this time?
I think XRP can reach (at least) $0.48 this time.
Ideal buy zone is $0.43 to $0.44.
Stop-loss should be placed on $0.396 or below.
This is not a financial advise.
bull pattern inside bull pattern inside bull pattern.this bullflag inside an inverse head and shoulders inside a bullish ascending triangle should provide a triple threat of bullish momentum that finally breaks us above the strong resistance at 8504 and allows us to achieve the elusive higher high on the weekly chart. We must always be ready for a potential fakeout of course but odds and probability strongly favor a successful bullish breakout. Targets for both the bull flag and inv h&s patterns are 8887 and the ascending triangle can take us into the 9.6k-9.9k region i've been predicting we'd reach been for awhile now before the correction its target is shown in the 9.7k range. Of course there is also a possibility that the ascending triangle is not just a triangle but an even bigger bullish pennant n which case we could break above 10k and even test 11k before the first significant correction. For now however that one is not quite as probable but we will have to see how things react once we reach the next major resistance just below 10k (assuming we break through 8504 resistance which probability highly favors)

BTC-USD(T) : Bullish pattern?It seems that a bullish pattern appears actually in the market:
A bullish flag, or to be more accurate, a bullish pennant .
The only argument I have now against this idea, is that actually the market seems "frozen" with a reduced volume, compared to previous days.
If BTC breaks up, it is important to see what happens next: will BTC brake also the very recent HIGH of 8350 USD? If so, then the market will warm up and we will head for 10k USD, or even 14k USD.
* If you win good money with my help and wish to offer me a beer, you can donate me some (fractions of) BTC.
BTC: 1BoZCLAoS26wAQPd75WixojoupW1mB4e3b

Possible ascending triangle bull pennant has a target of 10778btcusd has been consolidating inside an ascending triangle on the 4hr chart for a bit now and will likely continue at least one more leg up before the anticipated first real correction of this current bull run. On the 1 day chart shown here we are seeing that the triangle may not just be a triangle alone but also possibly a bullish pennant. If the bullish pennant is validated the breakout target is around 10,778 dollars. If only the ascending triangle itself is validated the target will be under 10k. You'll notice a few ideas back from this one I posted how I anticipate that much like the beginning of the last bull market and much like litecoin's price most recently displayed that odds are very good that we will see a 78.5% increase in bitcoins price from the point of its golden cross which when I did the math was in the 9.6k range. For that reason I have been saying that I don't think we will see a significant correction until we reach the 9.6-9.9k range. We have a very very significant horizontal resistance line here just under 10k at 9.9k and it could very easily be the rejection zone where our first significant correction begins. Of course if this bull pennant is validated, fomo can potentially take us as high as 11k before the rejection. Were the 9.9k zone to maintain strong resistance and instigate the correction however we would have essentially finished forming the body of a huge cup and handle and will have started forming its handle which when broken could send us skyrocketing. there may also be potential of forming a cup at the 11k range too though so I will have to take a look at that and get back to you on it. Lastly, even though this ascending triangle pattern has yet to have broken yet we just broke above an inverted head and shoulders pattern on the 4hr chart which has a breakout target that will send us right back up to the current strong horizontal resistance at $8504 and up out of the ascending triangle which should trigger the additional momentum we need to overcome the horizontal resistance line. There is a slight risk of a triple top a 8503 so keep an eye on that which if it were to form then our correction could come then but probability much more highly favors we break above it and head to at least 9.6k


ETH forming uptrend Bull PennantAs we can see the ETH is potentially forming an uptrend Bull Pennant. Going Long on ETH are not a bad choice in this case. I had opened my Long position since $167 and still keeping it, buying more.

BTCUSD. Golden Cross + Bullish Pennant PatternGolden Cross incoming (50MA cross up 200MA) + Bullish Pennant Pattern.
Be ready, something will moved soon!


CANOPY - Possible BULLISH Pennant breakout to new highs of $80Trying my beginners luck on my first post on stocks. I've been watching price action for Canadian weed stocks the past few months and it is now
finally breaking out of bearish bias, especially Canopy.
BEFORE entry, please look for confirmation on candlestick patterns or price action at important S/R lines.
If this chart helped at all, leave a like or follow.
I would love any feedback/advice about my chart to correct any of my mistakes and learn more about TA.
DISCLAIMER: Not a financial advisor, I don't suggest using my ideas for your own as I am a complete amateur for TA.
Good luck to everyone!

Bullish pennant on LINK, could aim for higher levels.LINK/BTC is currently within a bullish pennant/triangle formation, and it could look to move higher. It is nearing the end of this triangle, and we could see it move with conviction whichever way it breaks. Given the prior trend is bullish, I lean toward this being a bullish continuation pattern. If Bitcoin decides to decisively move either way, it can ruin the party pretty quickly for LINK. Also, if anyone wants to get a free stock from Robinhood, feel free to sign up using my referral link below. They also offer feeless cryptocurrency trading on a select few coins if you're in an approved state. I'll put an article down below for those interested in Robinhood crypto. I also accept BTC donations if you guys are feeling generous! :)
Entry: 11350-11750
Target 1: 15000 (Previous top.)
Target 2: 16500 (Mid-way point between the previous top at 15000 and the estimated measured move.)
Target 3: 18000 (Estimated target of the break-out by taking the measured move.)
SL: 10500-10750 depending on risk.
-This is not financial advice. Always do your own research and own due-diligence before investing and trading, as for investing and trading comes with high amounts of risk. I am not liable for any incurred losses or financial distress.
Robinhood crypto article: support.robinhood.com

$CGC: Bullish Pennant break out? ready for BLAST OFF!We are currently in a bullish pennant and I believe we are going to breakout to the upside. With the hype around the cannabis sector, it's not likely we will see a major correction before hitting all time high. Weekly Ichimoku cloud also indicates that we are in bullish trend for weeks and month to come.
Be patient and manage wisely :)
This is an analysis, not an investment advice.

PT.Sat NusaPersada,Tbk Bullish Pennant Come AcrossHello Guys,
today i'm gonna charting on $PTSN indonesian stock. it's recent huge gains with almost 600% up in recent months because of it's company fundamental good news which is the company prime export it's smarthome routers to United States according to the last month company news. it's wireless routers can support the realization of smarthome connection that requires high data bandwidth. and also the latest news from $PTSN is the cooperation of a Taiwan-based iPhone manufacturer, Pegatron Corporation, in early January 2019.
let's see how $PTSN technical analysis will go, as you can see on the daily chart, it's gently forming & establishing a bullish pennant while rejected two times in 1480 correction area which i marked with yellow boxes. so i assume it will totally break the pennant soon because it's good both in technical & fundamental. if the second impulse sticking out, it will retest 2200 area which is the previous swing high area. i'm jump aboard the trade, laddering buy at 1485 - 1550 area & will laddering take profits between blue box & green box area which means on 1700 - 2200 area.
but we can't make a 100% prediction on the trade,let's keep on eyes on the support area (cutloose are) at yellow & reed boxes on the chart. because the fundamental news can ruin it, like the US-China war trade & the indonesian presidential elections day on 19th april.
tab like button if like my analysis :)

XAUUSD | H4 | BULLISH — Back to Nursery.Analysis —
XAUUSD | H4 | BULLISH
Target @ 1311.50
This is the 100.00% Fibonacci.
This analysis has been established through our trend-based Fibonacci.
In addition to this is a classic example of a bullish pennant — a pattern every trader must memorise in Forex nursery school.
The price has been in consolidation amongst the 50.0% Fibonacci;
This key level has not necessarily shown much reaction yet has still proven to be a key zone.
In order to fulfil our target we must close above the resisting trend-line of our pennant,
We may expect a stop hunt re-testing the resistance turned support after a clear move has been made.
If a rejection occurs the price shall retest the support of the pennant.
Thank you.

Bull Pennant --- %14 Profit ChanceAda already broke the downtrend resistance and drawing a bull pennant atm.
Possible targets and stop level can be seen at the chart.
Good luck.

